Supported by Dr. Osamu Ogasawara and  . . |
|
Last data update: 2014.03.03 |
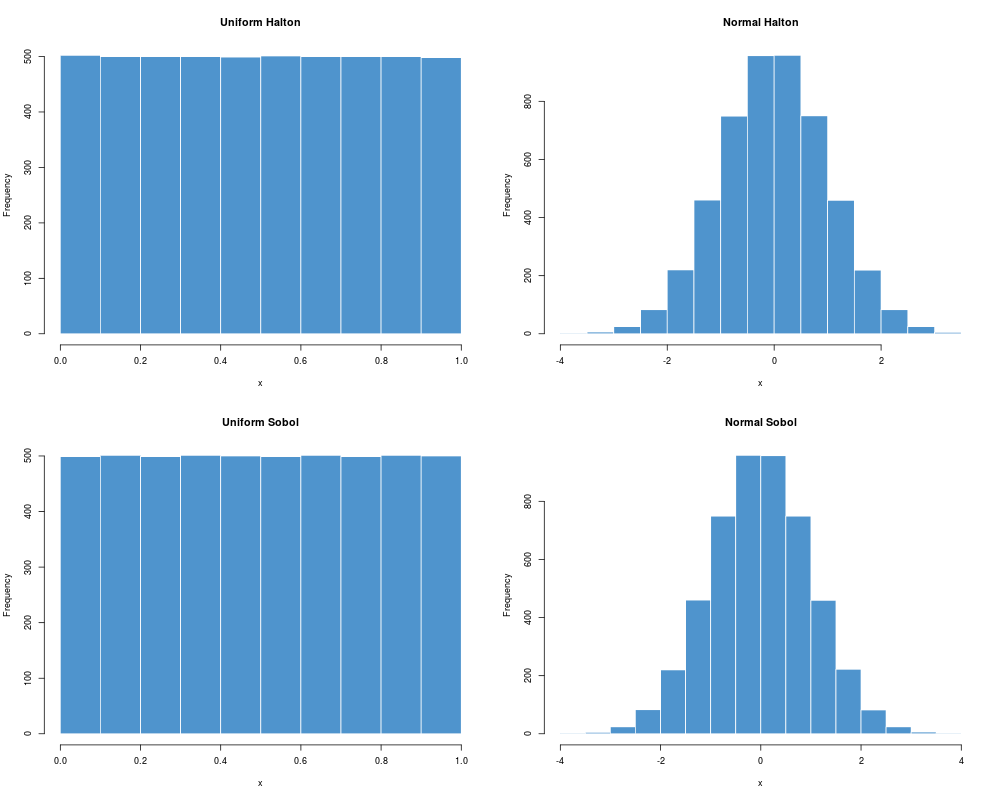
Low Discrepancy SequencesDescriptionA collection and description of functions to compute
Halton's and Sobol's low discrepancy sequences,
distributed in form of a uniform or normal distribution.
The functions are:
Usagerunif.halton(n, dimension, init) rnorm.halton(n, dimension, init) runif.sobol(n, dimension, init, scrambling, seed) rnorm.sobol(n, dimension, init, scrambling, seed) runif.pseudo(n, dimension, init) rnorm.pseudo(n, dimension, init) Arguments
DetailsHalton's Low Discrepancy Sequences:
Scrambled Sobol's Low Discrepancy Sequences:
Pseudo Random Number Sequence:
ValueAll generators return a numeric matrix of size NoteThe global variables The ACM Algorithm 659 implemented to generate scrambled
Sobol sequences is under the License of the ACM restricted
for academic and noncommerical usage. Please consult the
ACM License agreement included in the Author(s)P. Bratley and B.L. Fox for the Fortran Sobol Algorithm 659, ReferencesBratley P., Fox B.L. (1988); Algorithm 659: Implementing Sobol's Quasirandom Sequence Generator, ACM Transactions on Mathematical Software 14, 88–100. Joe S., Kuo F.Y. (1998); Remark on Algorithm 659: Implementing Sobol's Quaisrandom Seqence Generator. Examples
## *.halton -
   par(mfrow = c(2, 2), cex = 0.75)
   runif.halton(n = 10, dimension = 5)
   hist(runif.halton(n = 5000, dimension = 1), main = "Uniform Halton",
     xlab = "x", col = "steelblue3", border = "white")
   rnorm.halton(n = 10, dimension = 5)
   hist(rnorm.halton(n = 5000, dimension = 1), main = "Normal Halton",
     xlab = "x", col = "steelblue3", border = "white")

## *.sobol -
   runif.sobol(n = 10, dimension = 5, scrambling = 3)
   hist(runif.sobol(5000, 1, scrambling = 2), main = "Uniform Sobol",
     xlab = "x", col = "steelblue3", border = "white")
   rnorm.sobol(n = 10, dimension = 5, scrambling = 3)
   hist(rnorm.sobol(5000, 1, scrambling = 2), main = "Normal Sobol",
     xlab = "x", col = "steelblue3", border = "white")

## *.pseudo -
   runif.pseudo(n = 10, dimension = 5)
   rnorm.pseudo(n = 10, dimension = 5)
Results
R version 3.3.1 (2016-06-21) -- "Bug in Your Hair"
Copyright (C) 2016 The R Foundation for Statistical Computing
Platform: x86_64-pc-linux-gnu (64-bit)

R is free software and comes with ABSOLUTELY NO WARRANTY.
You are welcome to redistribute it under certain conditions.
Type 'license()' or 'licence()' for distribution details.

R is a collaborative project with many contributors.
Type 'contributors()' for more information and
'citation()' on how to cite R or R packages in publications.

Type 'demo()' for some demos, 'help()' for on-line help, or
'help.start()' for an HTML browser interface to help.
Type 'q()' to quit R.

> library(GLDEX)
Loading required package: cluster
> png(filename="/home/ddbj/snapshot/RGM3/R_CC/result/GLDEX/085A-LowDiscrepancy.Rd_%03d_medium.png", width=480, height=480)
> ### Name: LowDiscrepancy
> ### Title: Low Discrepancy Sequences
> ### Aliases: LowDiscrepancy runif.halton rnorm.halton runif.sobol
> ###   rnorm.sobol runif.pseudo rnorm.pseudo
> ### Keywords: programming
>
> ### ** Examples
>
> ## *.halton -
>    par(mfrow = c(2, 2), cex = 0.75)
>    runif.halton(n = 10, dimension = 5)
        [,1]       [,2] [,3]       [,4]       [,5]
 [1,] 0.5000 0.33333333 0.20 0.14285714 0.09090909
 [2,] 0.2500 0.66666667 0.40 0.28571429 0.18181818
 [3,] 0.7500 0.11111111 0.60 0.42857143 0.27272727
 [4,] 0.1250 0.44444444 0.80 0.57142857 0.36363636
 [5,] 0.6250 0.77777778 0.04 0.71428571 0.45454545
 [6,] 0.3750 0.22222222 0.24 0.85714286 0.54545455
 [7,] 0.8750 0.55555556 0.44 0.02040816 0.63636364
 [8,] 0.0625 0.88888889 0.64 0.16326531 0.72727273
 [9,] 0.5625 0.03703704 0.84 0.30612245 0.81818182
[10,] 0.3125 0.37037037 0.08 0.44897959 0.90909091
>    hist(runif.halton(n = 5000, dimension = 1), main = "Uniform Halton",
+      xlab = "x", col = "steelblue3", border = "white")
>    rnorm.halton(n = 10, dimension = 5)
            [,1]       [,2]       [,3]       [,4]       [,5]
 [1,]  0.0000000 -0.4307273 -0.8416212 -1.0675705 -1.3351778
 [2,] -0.6744898  0.4307273 -0.2533471 -0.5659489 -0.9084579
 [3,]  0.6744898 -1.2206404  0.2533471 -0.1800124 -0.6045854
 [4,] -1.1503494 -0.1397103  0.8416212  0.1800124 -0.3487557
 [5,]  0.3186394  0.7647097 -1.7506861  0.5659489 -0.1141853
 [6,] -0.3186394 -0.7647097 -0.7063026  1.0675705  0.1141853
 [7,]  1.1503494  0.1397103 -0.1509692 -2.0453910  0.3487557
 [8,] -1.5341206  1.2206404  0.3584588 -0.9811260  0.6045854
 [9,]  0.1573107 -1.7861556  0.9944579 -0.5068717  0.9084579
[10,] -0.4887764 -0.3308726 -1.4050716 -0.1282398  1.3351778
>    hist(rnorm.halton(n = 5000, dimension = 1), main = "Normal Halton",
+      xlab = "x", col = "steelblue3", border = "white")
>
> ## *.sobol -
>    runif.sobol(n = 10, dimension = 5, scrambling = 3)
             [,1]       [,2]      [,3]      [,4]       [,5]
 [1,] 0.950436354 0.68109632 0.7964227 0.7789565 0.23022611
 [2,] 0.505117714 0.10001624 0.5394356 0.1626085 0.29512087
 [3,] 0.174511582 0.78909695 0.1558686 0.5312862 0.65873003
 [4,] 0.677048266 0.93456304 0.3741792 0.9448425 0.60587275
 [5,] 0.002695477 0.23692979 0.9461251 0.3135361 0.46957344
 [6,] 0.447998971 0.54445767 0.7023838 0.7443066 0.03626848
 [7,] 0.872369766 0.34755683 0.1179214 0.1217073 0.91564041
 [8,] 0.418673068 0.05109646 0.2309225 0.9069471 0.13713892
 [9,] 0.776573598 0.86932755 0.5893980 0.2873443 0.75079370
[10,] 0.706255794 0.41129673 0.8402236 0.6534177 0.69252151
>    hist(runif.sobol(5000, 1, scrambling = 2), main = "Uniform Sobol",
+      xlab = "x", col = "steelblue3", border = "white")
>    rnorm.sobol(n = 10, dimension = 5, scrambling = 3)
             [,1]       [,2]       [,3]        [,4]        [,5]
 [1,]  1.64909933  0.4707667  0.8289112  0.76867389 -0.73810241
 [2,]  0.01282859 -1.2814591  0.0990120 -0.98379378 -0.53848580
 [3,] -0.93648572  0.8032918 -1.0115836  0.07850354  0.40899966
 [4,]  0.45946060  1.5106647 -0.3208048  1.59677855  0.26857795
 [5,] -2.78269455 -0.7162134  1.6083904 -0.48585188 -0.07634218
 [6,] -0.13071858  0.1116705  0.5312691  0.65667975 -1.79573322
 [7,]  1.13766483 -0.3919250 -1.1854420 -1.16649456  1.37633104
 [8,] -0.20528928 -1.6343141 -0.7358122  1.32218750 -1.09326416
 [9,]  0.76067235  1.1232180  0.2259968 -0.56115990  0.67698953
[10,]  0.54247926 -0.2242106  0.9953773  0.39456417  0.50301041
>    hist(rnorm.sobol(5000, 1, scrambling = 2), main = "Normal Sobol",
+      xlab = "x", col = "steelblue3", border = "white")
>
> ## *.pseudo -
>    runif.pseudo(n = 10, dimension = 5)
            [,1]      [,2]       [,3]       [,4]      [,5]
 [1,] 0.93530841 0.1105171 0.87071100 0.04094735 0.4988759
 [2,] 0.97728330 0.3134371 0.36585330 0.58175343 0.2590489
 [3,] 0.15846908 0.3949136 0.61377085 0.53319486 0.8955601
 [4,] 0.34321824 0.1986635 0.41948081 0.89907591 0.6284920
 [5,] 0.89463602 0.3426861 0.74678724 0.86753819 0.9112127
 [6,] 0.92327824 0.9777993 0.45463667 0.28489263 0.9196959
 [7,] 0.48751694 0.5654525 0.04446951 0.54850919 0.8268407
 [8,] 0.91635013 0.8500789 0.10413724 0.05804327 0.9532400
 [9,] 0.07842553 0.3611679 0.78436737 0.38760549 0.6044393
[10,] 0.19987153 0.2753105 0.38904842 0.86587817 0.3066829
>    rnorm.pseudo(n = 10, dimension = 5)
              [,1]        [,2]        [,3]         [,4]       [,5]
 [1,] -0.860540905 -1.10565568 -0.50577837 -0.497021664 -0.2545474
 [2,]  1.091070237  2.17917322  1.29886056 -1.046357600  0.2392156
 [3,]  0.649616335  1.40631299 -0.76628114 -0.734325566  1.1069426
 [4,]  0.025398987  1.11994335 -0.13781724 -1.345364230  0.3913045
 [5,] -1.780365971 -0.08316481 -0.83134536 -0.640525045  0.3501088
 [6,] -0.862440127  0.67063901  0.03221474 -0.477938100  0.2008953
 [7,] -0.009548991  0.74102669 -0.09158613  0.057860698  0.7616248
 [8,] -1.126801898  0.96014631 -1.26492343 -0.364364470 -2.2284123
 [9,] -0.553823719 -0.02496161  0.32501716 -0.005148393 -0.8925029
[10,] -1.545774979 -0.46138801 -0.47862738  0.585761079  1.0220073
>
>
>
>
>
> dev.off()
null device
          1
>
|