A vector of values for which the histogram is desired.
breaks
Either: 1) A vector giving the breakpoints between histogram
cells, OR 2) A single number giving the number of cells for the
histogram, OR 3) A character string naming an algorithm to compute the number
of cells (see Details), OR 4) A function to compute the number of cells.
freq
logical; if TRUE, the histogram graphic is a
representation of frequencies, the counts component of the result;
if FALSE, probability densities, component 'density', are plotted (so
that the histogram has a total area of one).
Defaults to TRUE iff 'breaks' are equidistant (and 'probability' is not
specified).
probability
A logical value, TRUE means it is not a frequency
graph.
include.lowest
If TRUE, an x[i] equal to the 'breaks'
value will be included in the first (or last, for right=FALSE) bar.
This will be ignored (with a warning) unless 'breaks' is a vector.
right
If TRUE, the histograms cells are right-closed
(left open) intervals.
density
The density of shading lines, in lines per inch. The default
value of NULL means that no shading lines are drawn.
Non-positive values of 'density' also inhibit the drawing of shading lines.
angle
The slope of shading lines, given as an angle in degrees
(counter-clockwise).
col
A colour to be used to fill the bars. The default of NULL
yields unfilled bars.
border
The color of the border around the bars. The default is to use
the standard foreground color.
main
Title of the graph.
xlim
A two valued vector specifying the lower and upper limits of the
x axis.
ylim
A two valued vector specifying the lower and upper limits of the
y axis.
xlab
X axis labels.
ylab
Y axis labels.
axes
Logical value, if TRUE, axis will be drawn.
plot
Logical value, if TRUE, plot will be drawn.
labels
Logical or character. Additionally draw labels on top of bars,
if not FALSE; see plot.histogram.
nclass
Number of bins of the histogram.
...
Other graphical parameters, see par for details.
Details
See hist help file. This function forces the number of class of
histogram to that as specified by the user.
Value
An object of class "histogram" which is a list with components:
breaks
The n+1 cell boundaries (=breaks if that was a vector).
counts
N integers; for each cell, the number of x[] inside.
density
Values as estimated density values. If all(diff(breaks)
== 1), they are the relative frequencies counts/n.
intensities
Same as density, deprecated.
mids
The n cell midpoints.
xname
A character string with the actual x argument name.
equidist
Logical, indicating if the distances between breaks
are all the same.
Note
Please see hist help file.
Author(s)
R development team with modifications by Steve Su
References
Venables, W. N. and Ripley. B. D. (2002) Modern Applied Statistics
with S. Springer.
See Also
hist
Examples
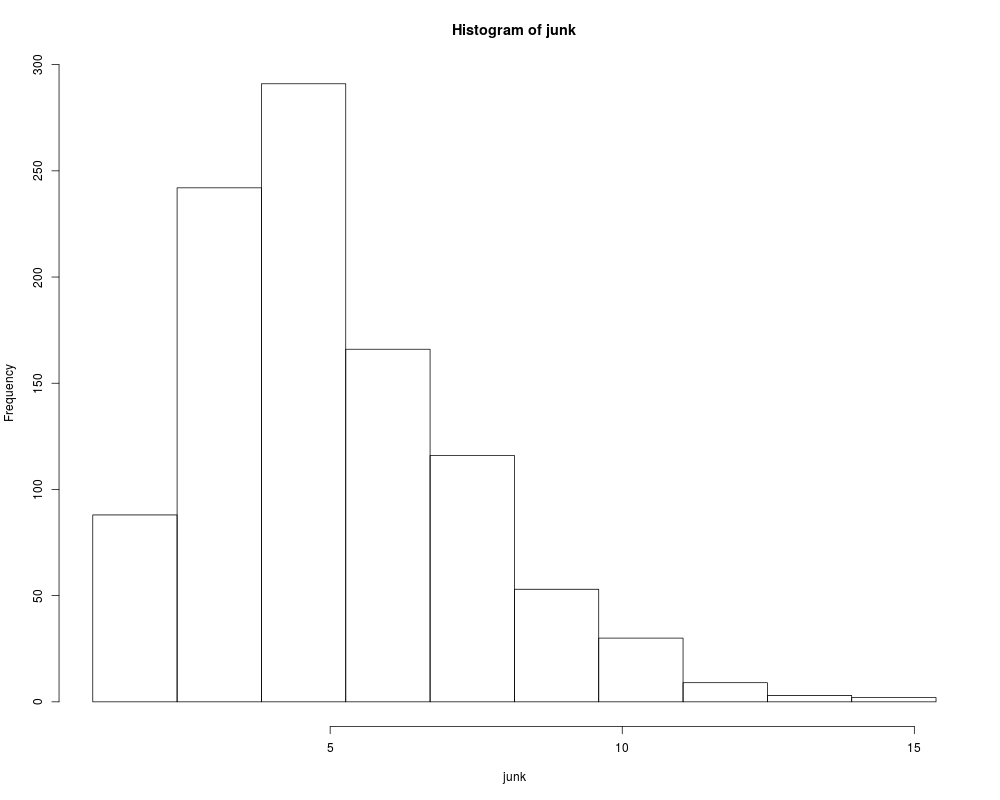
# See hist for extended example:
junk<-rgamma(1000,5)
# Forcing the number of bins to be 10:
histsu(junk,nclass=10)
Results
R version 3.3.1 (2016-06-21) -- "Bug in Your Hair"
Copyright (C) 2016 The R Foundation for Statistical Computing
Platform: x86_64-pc-linux-gnu (64-bit)

R is free software and comes with ABSOLUTELY NO WARRANTY.
You are welcome to redistribute it under certain conditions.
Type 'license()' or 'licence()' for distribution details.

R is a collaborative project with many contributors.
Type 'contributors()' for more information and
'citation()' on how to cite R or R packages in publications.

Type 'demo()' for some demos, 'help()' for on-line help, or
'help.start()' for an HTML browser interface to help.
Type 'q()' to quit R.

> library(GLDEX)
Loading required package: cluster
> png(filename="/home/ddbj/snapshot/RGM3/R_CC/result/GLDEX/histsu.Rd_%03d_medium.png", width=480, height=480)
> ### Name: histsu
> ### Title: Histogram with exact number of bins specified by the user
> ### Aliases: histsu
> ### Keywords: hplot
>
> ### ** Examples
>
> # See hist for extended example:
> junk<-rgamma(1000,5)
> # Forcing the number of bins to be 10:
> histsu(junk,nclass=10)
>
>
>
>
>
> dev.off()
null device
          1
>
 .
.