Supported by Dr. Osamu Ogasawara and  . . |
|
Last data update: 2014.03.03 |
Reproducibility between U133 plus 2 and Exon microarraysDescriptionThis dataset contains a FormatThe format of the
DetailsFurther details can be found in Bergkvist et al. (2014) and Rasmussen and Bilgrau et al. (2014). Author(s)Anders Ellern Bilgrau <anders.ellern.bilgrau@gmail.com> ReferencesBergkvist, Kim Steve, Mette Nyegaard, Martin Boegsted, Alexander Schmitz, Julie Stoeve Boedker, Simon Mylius Rasmussen, Martin Perez-Andres et al. (2014). "Validation and Implementation of a Method for Microarray Gene Expression Profiling of Minor B-Cell Subpopulations in Man". BMC immunology, 15(1), 3. Rasmussen SM, Bilgrau AE, Schmitz A, Falgreen S, Bergkvist KS, Tramm AM, Baech J, Jacobsen CL, Gaihede M, Kjeldsen MK, Boedker JS, Dybkaer K, Boegsted M, Johnsen HE (2015). "Stable Phenotype Of B-Cell Subsets Following Cryopreservation and Thawing of Normal Human Lymphocytes Stored in a Tissue Biobank." Cytometry Part B: Clinical Cytometry, 88(1), 40-49. Examplesdata(u133VsExon) str(u133VsExon) # Plot P-values plot(u133VsExon, cex = 0.5) # Plot ranked and scaled P-values plot(Uhat(1-u133VsExon), cex = 0.5) Results
R version 3.3.1 (2016-06-21) -- "Bug in Your Hair"
Copyright (C) 2016 The R Foundation for Statistical Computing
Platform: x86_64-pc-linux-gnu (64-bit)
R is free software and comes with ABSOLUTELY NO WARRANTY.
You are welcome to redistribute it under certain conditions.
Type 'license()' or 'licence()' for distribution details.
R is a collaborative project with many contributors.
Type 'contributors()' for more information and
'citation()' on how to cite R or R packages in publications.
Type 'demo()' for some demos, 'help()' for on-line help, or
'help.start()' for an HTML browser interface to help.
Type 'q()' to quit R.
> library(GMCM)
> png(filename="/home/ddbj/snapshot/RGM3/R_CC/result/GMCM/u133VsExon.Rd_%03d_medium.png", width=480, height=480)
> ### Name: u133VsExon
> ### Title: Reproducibility between U133 plus 2 and Exon microarrays
> ### Aliases: u133VsExon
> ### Keywords: data datasets,
>
> ### ** Examples
>
> data(u133VsExon)
> str(u133VsExon)
'data.frame': 19577 obs. of 2 variables:
$ u133: num 0.17561 0.00178 0.005371 0.000669 0.655261 ...
$ exon: num 1.07e-01 6.74e-10 1.51e-03 6.76e-05 3.36e-01 ...
>
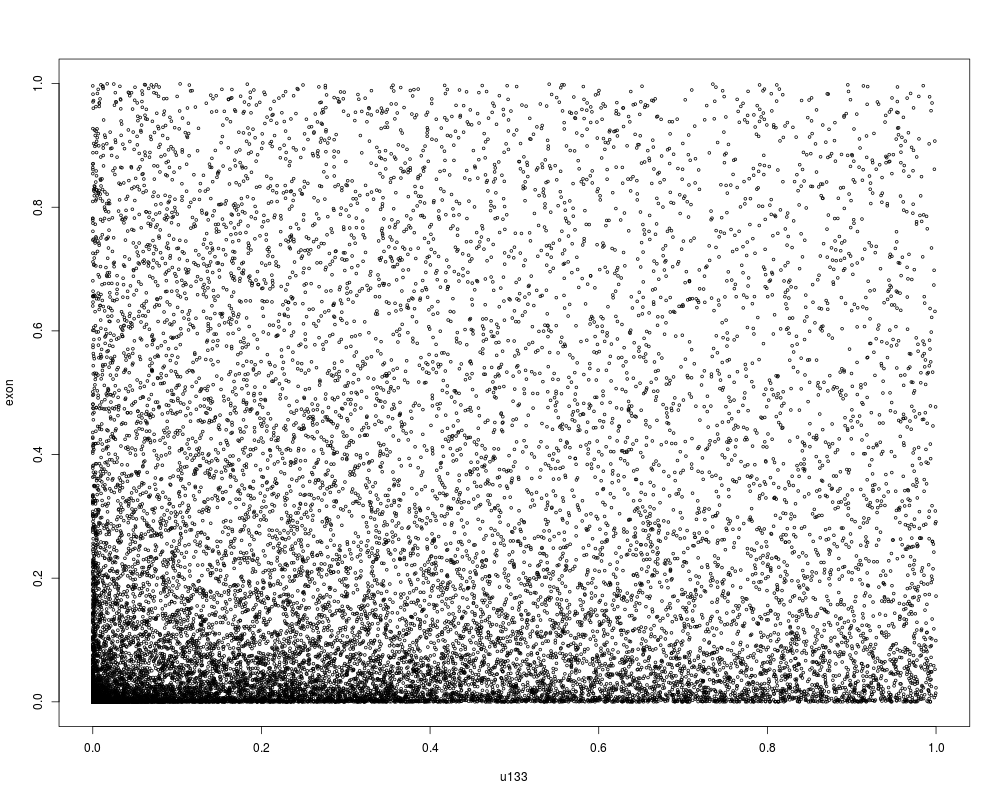
> # Plot P-values
> plot(u133VsExon, cex = 0.5)
>
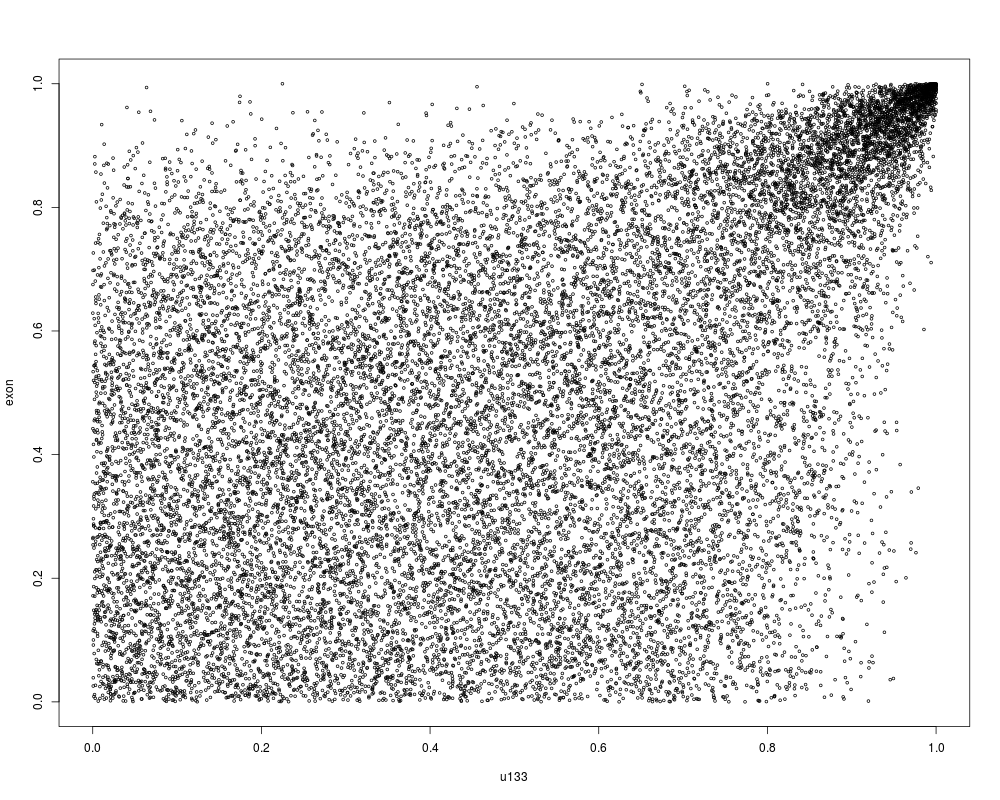
> # Plot ranked and scaled P-values
> plot(Uhat(1-u133VsExon), cex = 0.5)
>
>
>
>
>
> dev.off()
null device
1
>
|