Determining the number of clusters in a data set by the "elbow" rule.
Usage
## find a good k given thresholds of EV and its increment.
elbow(x,inc.thres,ev.thres,precision=3,print.warning=TRUE)

## a wrapper of `elbow' testing multiple thresholds.
elbow.batch(x,inc.thres=c(0.01,0.05,0.1),
ev.thres=c(0.95,0.9,0.8,0.75,0.67,0.5,0.33),precision=3)

## S3 method for class 'elbow'
plot(x,elbow.obj=NULL,main,xlab="k",
ylab="Explained_Variance",type="b",pch=20,col.abline="red",
lty.abline=3,if.plot.new=TRUE,print.info=TRUE,
mar=c(4,5,3,3),omi=c(0.75,0,0,0),...)
Arguments
x
a ‘css.multi’ object, generated by css.hclust
inc.thres
numeric with value(s) from 0 to 1, the threshold of the increment of EV.
A single value is used in elbow while a vector of values in elbow.batch.
ev.thres
numeric with value(s) from 0 to 1, the threshold of EV.
A single value is used in elbow while a vector of values in elbow.batch.
precision
integer, the number of digits to round for numerical comparison.
print.warning
logical, whether to print warning messages.
elbow.obj
a ‘elbow’ object, generated by elbow or elbow.batch
main
an overall title for the plot.
ylab
a title for the y axis.
xlab
a title for the x axis.
type
what type of plot should be drawn.
See help("plot", package="graphics").
pch
Either an integer specifying a symbol or a single character
to be used as the default in plotting points (see par).
col.abline
color for straight lines through the current plot
(see option col in par).
lty.abline
line type for straight lines through the current plot
(see option lty in par).
if.plot.new
logical, whether to start a new plot device or not.
print.info
logical, whether to print the information of ‘elbow.obj’.
mar
A numerical vector of the form 'c(bottom, left, top, right)'
which gives the number of lines of margin to be specified on
the four sides of the plot (see option mar in par).
The default is 'c(4, 5, 3, 3) + 0.1'.
omi
A vector of the form 'c(bottom, left, top, right)' giving the
size of the outer margins in inches (see option omi in par).
...
arguments to be passed to method plot.elbow,
such as graphical parameters (see par).
Details
Determining the number of clusters in a data set by the "elbow" rule and
thresholds in the explained variance (EV) and its increment.
Value
Both elbow and elbow.btach return a ‘elbow’ object
(if a "good" k exists),
which is a list containing the following components
k
number of clusters
ev
explained variance given k
inc.thres
the threshold of the increment in EV
ev.thres
the threshold of the EV
, and with an attribute ‘meta’ that contains
description
A description about the "good" k
See Also
css and css.hclust for computing Clustering Sum-of-Squares.
Examples
## load library
require("GMD")
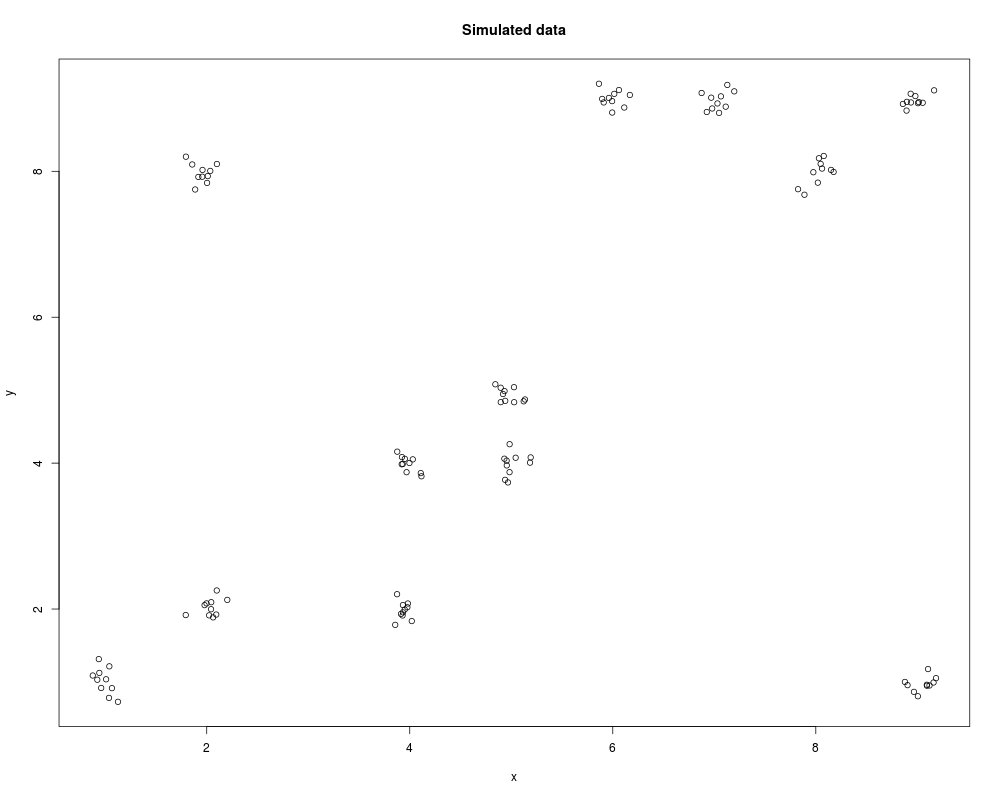
## simulate data around 12 points in Euclidean space
pointv <- data.frame(x=c(1,2,2,4,4,5,5,6,7,8,9,9),
y=c(1,2,8,2,4,4,5,9,9,8,1,9))
set.seed(2012)
mydata <- c()
for (i in 1:nrow(pointv)){
mydata <- rbind(mydata,cbind(rnorm(10,pointv[i,1],0.1),
rnorm(10,pointv[i,2],0.1)))
}
mydata <- data.frame(mydata); colnames(mydata) <- c("x","y")
plot(mydata,type="p",pch=21, main="Simulated data")
## determine a "good" k using elbow
dist.obj <- dist(mydata[,1:2])
hclust.obj <- hclust(dist.obj)
css.obj <- css.hclust(dist.obj,hclust.obj)
elbow.obj <- elbow.batch(css.obj)
print(elbow.obj)
## make partition given the "good" k
k <- elbow.obj$k; cutree.obj <- cutree(hclust.obj,k=k)
mydata$cluster <- cutree.obj
## draw a elbow plot and label the data
dev.new(width=12, height=6)
par(mfcol=c(1,2),mar=c(4,5,3,3),omi=c(0.75,0,0,0))
plot(mydata$x,mydata$y,pch=as.character(mydata$cluster),
col=mydata$cluster,cex=0.75,main="Clusters of simulated data")
plot(css.obj,elbow.obj,if.plot.new=FALSE)
## clustering with more relaxed thresholds (, resulting a smaller "good" k)
elbow.obj2 <- elbow.batch(css.obj,ev.thres=0.90,inc.thres=0.05)
mydata$cluster2 <- cutree(hclust.obj,k=elbow.obj2$k)
dev.new(width=12, height=6)
par(mfcol=c(1,2), mar=c(4,5,3,3),omi=c(0.75,0,0,0))
plot(mydata$x,mydata$y,pch=as.character(mydata$cluster2),
col=mydata$cluster2,cex=0.75,main="Clusters of simulated data")
plot(css.obj,elbow.obj2,if.plot.new=FALSE)
Results
R version 3.3.1 (2016-06-21) -- "Bug in Your Hair"
Copyright (C) 2016 The R Foundation for Statistical Computing
Platform: x86_64-pc-linux-gnu (64-bit)

R is free software and comes with ABSOLUTELY NO WARRANTY.
You are welcome to redistribute it under certain conditions.
Type 'license()' or 'licence()' for distribution details.

R is a collaborative project with many contributors.
Type 'contributors()' for more information and
'citation()' on how to cite R or R packages in publications.

Type 'demo()' for some demos, 'help()' for on-line help, or
'help.start()' for an HTML browser interface to help.
Type 'q()' to quit R.

> library(GMD)
> png(filename="/home/ddbj/snapshot/RGM3/R_CC/result/GMD/elbow.Rd_%03d_medium.png", width=480, height=480)
> ### Name: elbow
> ### Title: The "Elbow" Method for Clustering Evaluation
> ### Aliases: elbow elbow.batch plot.elbow
>
> ### ** Examples
>
> ## load library
> require("GMD")
>
> ## simulate data around 12 points in Euclidean space
> pointv <- data.frame(x=c(1,2,2,4,4,5,5,6,7,8,9,9),
+ y=c(1,2,8,2,4,4,5,9,9,8,1,9))
> set.seed(2012)
> mydata <- c()
> for (i in 1:nrow(pointv)){
+   mydata <- rbind(mydata,cbind(rnorm(10,pointv[i,1],0.1),
+ rnorm(10,pointv[i,2],0.1)))
+ }
> mydata <- data.frame(mydata); colnames(mydata) <- c("x","y")
> plot(mydata,type="p",pch=21, main="Simulated data")
>
> ## determine a "good" k using elbow
> dist.obj <- dist(mydata[,1:2])
> hclust.obj <- hclust(dist.obj)
> css.obj <- css.hclust(dist.obj,hclust.obj)
> elbow.obj <- elbow.batch(css.obj)
> print(elbow.obj)
$k
[1] 7

$ev
[1] 0.9795881

$inc.thres
[1] 0.01

$ev.thres
[1] 0.95

attr(,"description")
[1] "A "good" k=7 (EV=0.98) is detected when the EV is no less than 0.95\nand the increment of EV is no more than 0.01 for a bigger k.\n"
attr(,"class")
[1] "elbow" "list"
>
> ## make partition given the "good" k
> k <- elbow.obj$k; cutree.obj <- cutree(hclust.obj,k=k)
> mydata$cluster <- cutree.obj
>
> ## draw a elbow plot and label the data
> dev.new(width=12, height=6)
dev.new(): using pdf(file="Rplots976.pdf")
> par(mfcol=c(1,2),mar=c(4,5,3,3),omi=c(0.75,0,0,0))
> plot(mydata$x,mydata$y,pch=as.character(mydata$cluster),
+ col=mydata$cluster,cex=0.75,main="Clusters of simulated data")
> plot(css.obj,elbow.obj,if.plot.new=FALSE)
There were 50 or more warnings (use warnings() to see the first 50)
>
> ## clustering with more relaxed thresholds (, resulting a smaller "good" k)
> elbow.obj2 <- elbow.batch(css.obj,ev.thres=0.90,inc.thres=0.05)
> mydata$cluster2 <- cutree(hclust.obj,k=elbow.obj2$k)
>
> dev.new(width=12, height=6)
dev.new(): using pdf(file="Rplots977.pdf")
> par(mfcol=c(1,2), mar=c(4,5,3,3),omi=c(0.75,0,0,0))
> plot(mydata$x,mydata$y,pch=as.character(mydata$cluster2),
+ col=mydata$cluster2,cex=0.75,main="Clusters of simulated data")
> plot(css.obj,elbow.obj2,if.plot.new=FALSE)
There were 50 or more warnings (use warnings() to see the first 50)
>
>
>
>
>
> dev.off()
png
  2
>
 .
.