Supported by Dr. Osamu Ogasawara and  . . |
|
Last data update: 2014.03.03 |
Plot function for class gmdpDescriptionPlot Function for Class Usage## S3 method for class 'gmdp' plot(x, labels = NULL, colors = NULL, main, ylab = "Fraction", xlab = "Position", xlim = NULL, type = NULL, if.text.gmd = TRUE, if.text.gap = TRUE, ...) Arguments
DetailsPlot Function for Class ReferencesSee See Also
Examples
require("GMD") # load library
data(cage) # load data
## measure pairwise distance
x <- gmdp(cage[["Pfkfb3 (T02R00AEC2D8)"]],cage[["Csf1 (T03R0672174D)"]])
print(x) # print a brief version by default
print(x, mode="full") # print a full version by default
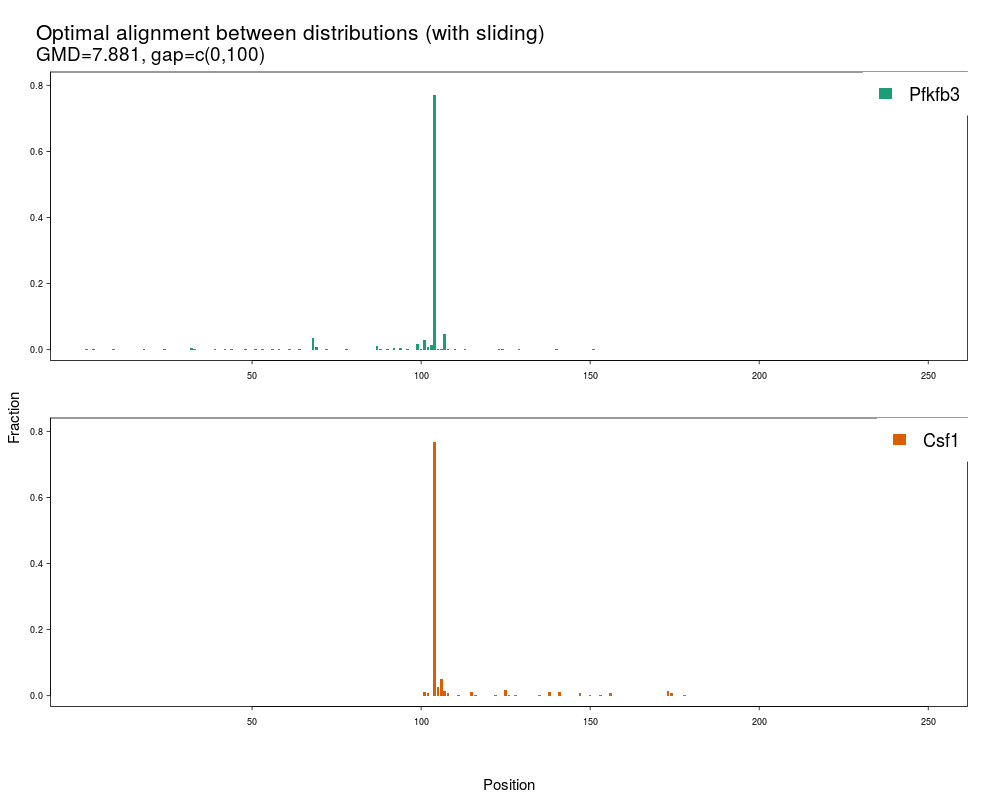
## show alignment
plot(x,labels=c("Pfkfb3","Csf1"),beside=FALSE)
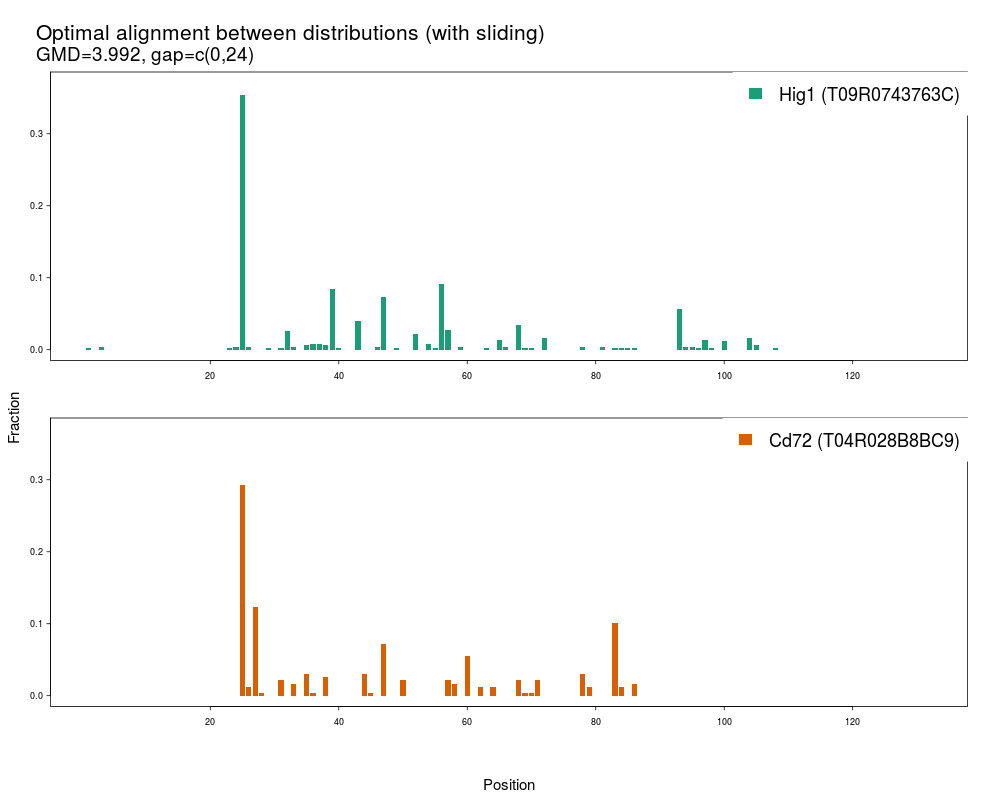
## show another alignment
plot(gmdp(cage[["Hig1 (T09R0743763C)"]],cage[["Cd72 (T04R028B8BC9)"]]),
labels=c("Hig1 (T09R0743763C)","Cd72 (T04R028B8BC9)"),
beside=FALSE)
Results
R version 3.3.1 (2016-06-21) -- "Bug in Your Hair"
Copyright (C) 2016 The R Foundation for Statistical Computing
Platform: x86_64-pc-linux-gnu (64-bit)

R is free software and comes with ABSOLUTELY NO WARRANTY.
You are welcome to redistribute it under certain conditions.
Type 'license()' or 'licence()' for distribution details.

R is a collaborative project with many contributors.
Type 'contributors()' for more information and
'citation()' on how to cite R or R packages in publications.

Type 'demo()' for some demos, 'help()' for on-line help, or
'help.start()' for an HTML browser interface to help.
Type 'q()' to quit R.

> library(GMD)
> png(filename="/home/ddbj/snapshot/RGM3/R_CC/result/GMD/plot.gmdp.Rd_%03d_medium.png", width=480, height=480)
> ### Name: plot.gmdp
> ### Title: Plot function for class gmdp
> ### Aliases: plot.gmdp
> ### Keywords: hplot methods
>
> ### ** Examples
>
> require("GMD") # load library
> data(cage)     # load data
>
> ## measure pairwise distance
> x <- gmdp(cage[["Pfkfb3 (T02R00AEC2D8)"]],cage[["Csf1 (T03R0672174D)"]])
> print(x)                     # print a brief version by default
[1] 7.881066
> print(x, mode="full")  # print a full version by default

Distribution of v1:
1 0 2 0 0 0 0 0 1 0 0 0 0 0 0 0 0 1 0 0 0 0 0 1 0 0 0 0 0 0 0 4 1 0 0 0 0 0 1 0 0 2 0 2 0 0 0 1 0 0 2 0 1 0 0 3 0 1 0 0 1 0 0 1 0 0 0 35 7 0 0 1 0 0 0 0 0 2 0 0 0 0 0 0 0 0 11 2 0 2 0 5 0 5 0 2 0 0 17 1 31 10 16 791 2 1 50 1 0 1 0 0 3 0 0 0 0 0 0 0 0 0 1 1 0 0 0 0 1 0 0 0 0 0 0 0 0 0 0 1 0 0 0 0 0 0 0 0 0 0 2
(After normalization)
0.001 0 0.002 0 0 0 0 0 0.001 0 0 0 0 0 0 0 0 0.001 0 0 0 0 0 0.001 0 0 0 0 0 0 0 0.004 0.001 0 0 0 0 0 0.001 0 0 0.002 0 0.002 0 0 0 0.001 0 0 0.002 0 0.001 0 0 0.003 0 0.001 0 0 0.001 0 0 0.001 0 0 0 0.034 0.007 0 0 0.001 0 0 0 0 0 0.002 0 0 0 0 0 0 0 0 0.011 0.002 0 0.002 0 0.005 0 0.005 0 0.002 0 0 0.017 0.001 0.03 0.01 0.016 0.769 0.002 0.001 0.049 0.001 0 0.001 0 0 0.003 0 0 0 0 0 0 0 0 0 0.001 0.001 0 0 0 0 0.001 0 0 0 0 0 0 0 0 0 0 0.001 0 0 0 0 0 0 0 0 0 0 0.002

Distribution of v2:
3 2 0 221 8 15 4 2 0 0 1 0 0 0 3 1 0 0 0 0 0 1 0 0 5 1 0 1 0 0 0 0 0 0 1 0 0 3 0 0 3 0 0 0 0 0 2 0 0 1 0 0 1 0 0 2 0 0 0 0 0 0 0 0 0 0 0 0 0 0 0 0 4 2 0 0 0 1
(After normalization)
0.01 0.007 0 0.767 0.028 0.052 0.014 0.007 0 0 0.003 0 0 0 0.01 0.003 0 0 0 0 0 0.003 0 0 0.017 0.003 0 0.003 0 0 0 0 0 0 0.003 0 0 0.01 0 0 0.01 0 0 0 0 0 0.007 0 0 0.003 0 0 0.003 0 0 0.007 0 0 0 0 0 0 0 0 0 0 0 0 0 0 0 0 0.014 0.007 0 0 0 0.003

GM-Distance: 7.881

Sliding: TRUE

Number of hits: 1

Gap:
	v1	v2
Hit1	0	100


Resolution: 1


>
> ## show alignment
> plot(x,labels=c("Pfkfb3","Csf1"),beside=FALSE)

Warning messages:
1: In equalize.list(x) :
  Number of bins are not equal for all members. Shorter ones is padded with `NA' values.
2: In as.mhist(tmp.x) :
  `bins' are not specified; use automatic numbering instead under assumption
that memeber histograms have the same order of the bins.
>
> ## show another alignment
> plot(gmdp(cage[["Hig1 (T09R0743763C)"]],cage[["Cd72 (T04R028B8BC9)"]]),
+      labels=c("Hig1 (T09R0743763C)","Cd72 (T04R028B8BC9)"),
+      beside=FALSE)

Warning messages:
1: In equalize.list(x) :
  Number of bins are not equal for all members. Shorter ones is padded with `NA' values.
2: In as.mhist(tmp.x) :
  `bins' are not specified; use automatic numbering instead under assumption
that memeber histograms have the same order of the bins.
>
>
>
>
>
> dev.off()
null device
          1
>
|