Supported by Dr. Osamu Ogasawara and  . . |
|
Last data update: 2014.03.03 |
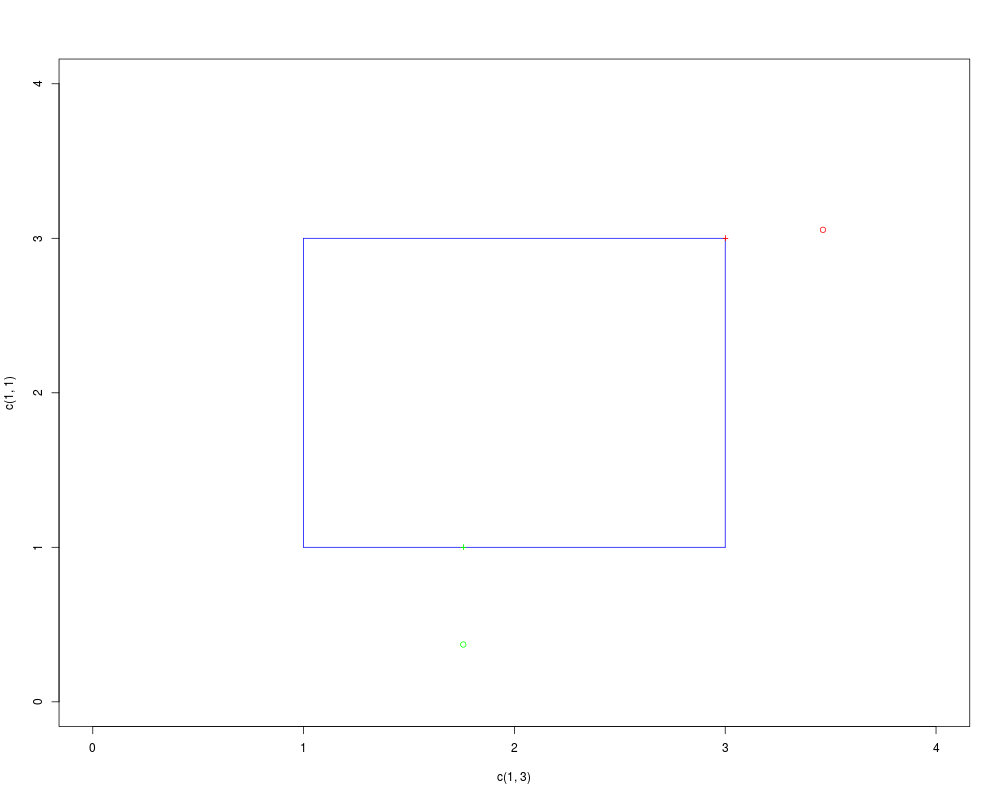
Projection of a point on a setDescriptionProjection of a point Usageprojector(z, g, jacg, bounds=c(0, 10), echo=FALSE, ...) Arguments
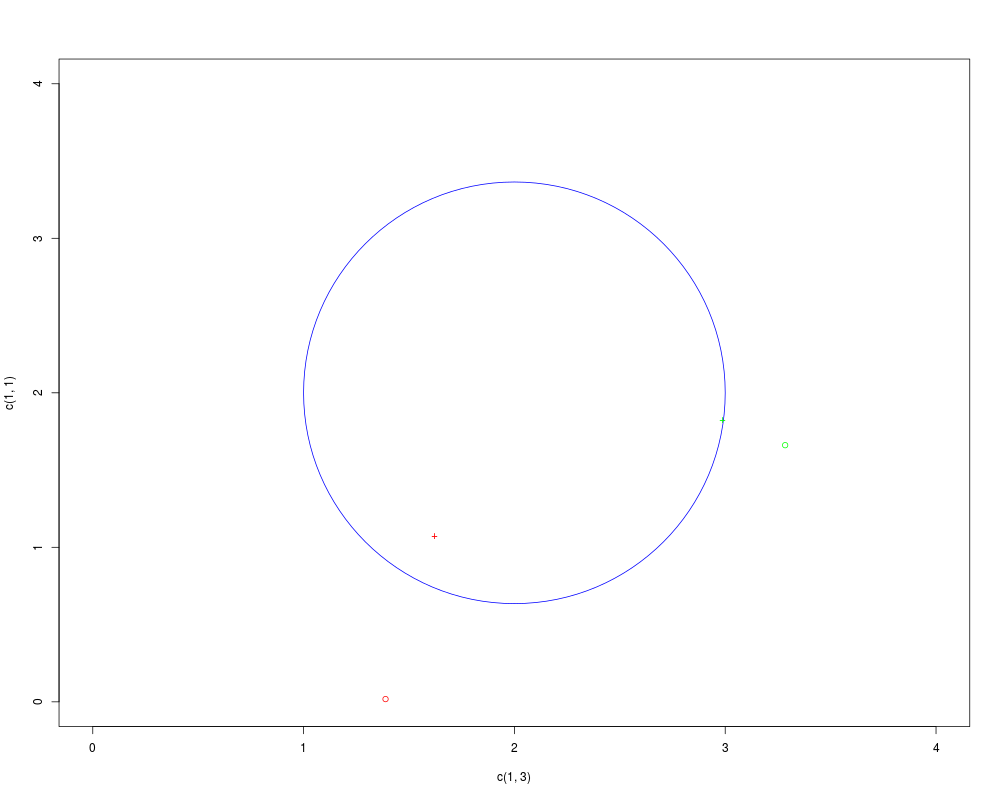
DetailsFind a point ValueA vector Author(s)Christophe Dutang See AlsoSee also Examples# 1. the rectangle set # g <- function(x) c(x - 3, 1 - x) jacg <- function(x) rbind( diag( rep(1, length(x)) ), diag( rep(-1, length(x)) ) ) z <- runif(2, 3, 4) #computation projz <- projector(z, g, jacg) #plot plot(c(1, 3), c(1, 1), xlim=c(0, 4), ylim=c(0,4), type="l", col="blue") lines(c(3, 3), c(1, 3), col="blue") lines(c(3, 1), c(3, 3), col="blue") lines(c(1, 1), c(3, 1), col="blue") points(z[1], z[2], col="red") points(projz[1], projz[2], col="red", pch="+") z <- runif(2) + c(1, 0) projz <- projector(z, g, jacg) points(z[1], z[2], col="green") points(projz[1], projz[2], col="green", pch="+") # 2. the circle set # g <- function(x) sum((x-2)^2)-1 jacg <- function(x) as.matrix( 2*(x-2) ) z <- runif(2) + c(1, 0) #computation projz <- projector(z, g, jacg) #plot plot(c(1, 3), c(1, 1), xlim=c(0, 4), ylim=c(0,4), type="n", col="blue") symbols(2, 2, circles=1, fg="blue", add=TRUE, inches=FALSE) points(z[1], z[2], col="red") points(projz[1], projz[2], col="red", pch="+") z <- c(runif(1, 3, 4), runif(1, 1, 2)) projz <- projector(z, g, jacg) points(z[1], z[2], col="green") points(projz[1], projz[2], col="green", pch="+") Results
R version 3.3.1 (2016-06-21) -- "Bug in Your Hair"
Copyright (C) 2016 The R Foundation for Statistical Computing
Platform: x86_64-pc-linux-gnu (64-bit)

R is free software and comes with ABSOLUTELY NO WARRANTY.
You are welcome to redistribute it under certain conditions.
Type 'license()' or 'licence()' for distribution details.

R is a collaborative project with many contributors.
Type 'contributors()' for more information and
'citation()' on how to cite R or R packages in publications.

Type 'demo()' for some demos, 'help()' for on-line help, or
'help.start()' for an HTML browser interface to help.
Type 'q()' to quit R.

> library(GNE)
Loading required package: alabama
Loading required package: numDeriv
Loading required package: nleqslv
Loading required package: BB
Loading required package: SQUAREM
> png(filename="/home/ddbj/snapshot/RGM3/R_CC/result/GNE/util-projection.Rd_%03d_medium.png", width=480, height=480)
> ### Name: projector
> ### Title: Projection of a point on a set
> ### Aliases: projector Projector
> ### Keywords: nonlinear optimize
>
> ### ** Examples
>
>
> # 1. the rectangle set
> #
>
> g <- function(x)
+ 	c(x - 3, 1 - x)
>
> jacg <- function(x)
+ 	rbind(
+ 	diag( rep(1, length(x)) ),
+ 	diag( rep(-1, length(x)) )
+ 	)
>
> z <- runif(2, 3, 4)
>
> #computation
> projz <- projector(z, g, jacg)
>
> #plot
> plot(c(1, 3), c(1, 1), xlim=c(0, 4), ylim=c(0,4), type="l", col="blue")
> lines(c(3, 3), c(1, 3), col="blue")
> lines(c(3, 1), c(3, 3), col="blue")
> lines(c(1, 1), c(3, 1), col="blue")
>
> points(z[1], z[2], col="red")
> points(projz[1], projz[2], col="red", pch="+")
>
> z <- runif(2) + c(1, 0)
> projz <- projector(z, g, jacg)
>
> points(z[1], z[2], col="green")
> points(projz[1], projz[2], col="green", pch="+")
>
>
>
> # 2. the circle set
> #
>
> g <- function(x) sum((x-2)^2)-1
> jacg <- function(x) as.matrix( 2*(x-2) )
>
> z <- runif(2) + c(1, 0)
>
> #computation
> projz <- projector(z, g, jacg)
>
> #plot
> plot(c(1, 3), c(1, 1), xlim=c(0, 4), ylim=c(0,4), type="n", col="blue")
> symbols(2, 2, circles=1, fg="blue", add=TRUE, inches=FALSE)
>
> points(z[1], z[2], col="red")
> points(projz[1], projz[2], col="red", pch="+")
>
> z <- c(runif(1, 3, 4), runif(1, 1, 2))
> projz <- projector(z, g, jacg)
>
> points(z[1], z[2], col="green")
> points(projz[1], projz[2], col="green", pch="+")
>
>
>
>
>
>
>
> dev.off()
null device
          1
>
|
Created & Maintained by Osamu Ogasawara (osamu.ogasawara@gmail.com) and 