Supported by Dr. Osamu Ogasawara and  . . |
|
Last data update: 2014.03.03 |
Covariance function. Linear covariance function.DescriptionNon-stationary covariance function. Usagecov.linear(hyper, Data, Data.new = NULL) Arguments
DetailsThe names for the hyper parameters should be:"linear.a" for linear covariance function, "pow.ex.w", "pow.ex.v" for power exponential, "rat.qu.s", "rat.qu.a" for rational quadratic, "vv" for white noise. All hyper parameters should be in one list. Value
Author(s)Jian Qing Shi & Yafeng Cheng ReferencesShi, J Q., and Choi, T. (2011), Gaussian Process Regression Analysis for Functional Data, Springer, New York. See Also
Examples
library(GPFDA)
require(MASS)
set.seed(30)
hp <- list('pow.ex.w'=log(10),'linear.a'=log(10),'pow.ex.v'=log(5),
'vv'=log(1))
c <- seq(0,1,len=40)
idx <- sort(sample(1:40,21))
X <- as.matrix(c[idx])
Y <- (mvrnorm(n=40,mu=c-c,Sigma=(cov.linear(hp,c)+cov.pow.ex(hp,c)))[,1]
)*0.1+sin(c*6)
Y <- as.matrix(Y[idx])
x <- as.matrix(seq(0,1,by=0.03))
a <- gpr(X,Y,c('linear'),hp)
b <- gppredict(a,x)
upper=b$pred.mean+1.96*b$pred.sd
lower=b$pred.mean-1.96*b$pred.sd
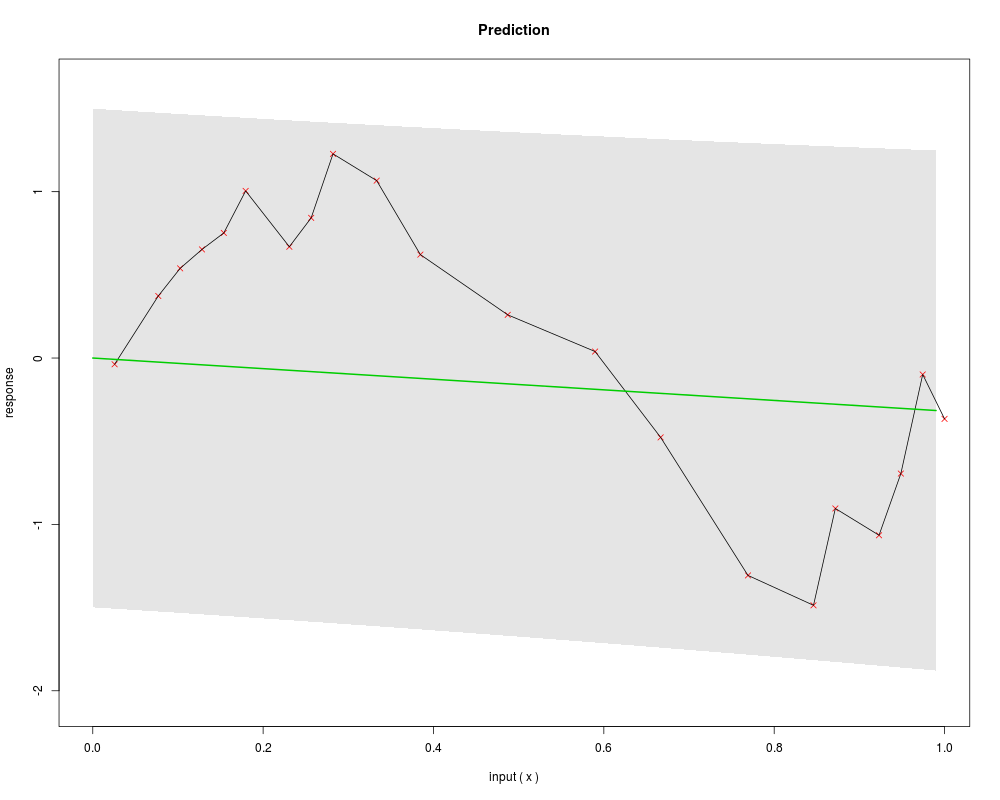
plot(-100,-100,col=0,xlim=range(x[,1]),ylim=c(min(upper,lower,Y)-
0.1*abs(min(upper,lower,Y)),max(upper,lower,Y)+0.1*abs(max(upper,
lower,Y))),main="Prediction", xlab="input ( x )",ylab="response")
polygon(c(x[,1], rev(x[,1])), c(upper, rev(lower)),col = "grey90",
border = NA)
points(X[,1],Y,pch=4,col=2)
lines(X[,1],Y)
lines(x[,1],b$pred.mean,col=3,lwd=2)
Results
R version 3.3.1 (2016-06-21) -- "Bug in Your Hair"
Copyright (C) 2016 The R Foundation for Statistical Computing
Platform: x86_64-pc-linux-gnu (64-bit)

R is free software and comes with ABSOLUTELY NO WARRANTY.
You are welcome to redistribute it under certain conditions.
Type 'license()' or 'licence()' for distribution details.

R is a collaborative project with many contributors.
Type 'contributors()' for more information and
'citation()' on how to cite R or R packages in publications.

Type 'demo()' for some demos, 'help()' for on-line help, or
'help.start()' for an HTML browser interface to help.
Type 'q()' to quit R.

> library(GPFDA)
Loading required package: fda.usc
Loading required package: fda
Loading required package: splines
Loading required package: Matrix

Attaching package: 'fda'

The following object is masked from 'package:graphics':

    matplot

Loading required package: MASS
Loading required package: mgcv
Loading required package: nlme
This is mgcv 1.8-12. For overview type 'help("mgcv-package")'.
Loading required package: rpart
Loading required package: spam
Loading required package: grid
Spam version 1.3-0 (2015-10-24) is loaded.
Type 'help( Spam)' or 'demo( spam)' for a short introduction
and overview of this package.
Help for individual functions is also obtained by adding the
suffix '.spam' to the function name, e.g. 'help( chol.spam)'.

Attaching package: 'spam'

The following objects are masked from 'package:base':

    backsolve, forwardsolve

> png(filename="/home/ddbj/snapshot/RGM3/R_CC/result/GPFDA/cov.linear.Rd_%03d_medium.png", width=480, height=480)
> ### Name: cov.linear
> ### Title: Covariance function. Linear covariance function.
> ### Aliases: cov.linear
>
> ### ** Examples
>
> library(GPFDA)
> require(MASS)
>
> set.seed(30)
> hp <- list('pow.ex.w'=log(10),'linear.a'=log(10),'pow.ex.v'=log(5),
+       'vv'=log(1))
> c <- seq(0,1,len=40)
> idx <- sort(sample(1:40,21))
> X <- as.matrix(c[idx])
> Y <- (mvrnorm(n=40,mu=c-c,Sigma=(cov.linear(hp,c)+cov.pow.ex(hp,c)))[,1]
+       )*0.1+sin(c*6)
> Y <- as.matrix(Y[idx])
> x <- as.matrix(seq(0,1,by=0.03))
> a <- gpr(X,Y,c('linear'),hp)
> b <- gppredict(a,x)
>
> upper=b$pred.mean+1.96*b$pred.sd
> lower=b$pred.mean-1.96*b$pred.sd
> plot(-100,-100,col=0,xlim=range(x[,1]),ylim=c(min(upper,lower,Y)-
+       0.1*abs(min(upper,lower,Y)),max(upper,lower,Y)+0.1*abs(max(upper,
+       lower,Y))),main="Prediction", xlab="input ( x )",ylab="response")
> polygon(c(x[,1], rev(x[,1])), c(upper, rev(lower)),col = "grey90",
+       border = NA)
> points(X[,1],Y,pch=4,col=2)
>
> lines(X[,1],Y)
> lines(x[,1],b$pred.mean,col=3,lwd=2)
>
>
>
>
>
> dev.off()
null device
          1
>
|
Created & Maintained by Osamu Ogasawara (osamu.ogasawara@gmail.com) and 