R version 3.3.1 (2016-06-21) -- "Bug in Your Hair"
Copyright (C) 2016 The R Foundation for Statistical Computing
Platform: x86_64-pc-linux-gnu (64-bit)
R is free software and comes with ABSOLUTELY NO WARRANTY.
You are welcome to redistribute it under certain conditions.
Type 'license()' or 'licence()' for distribution details.
R is a collaborative project with many contributors.
Type 'contributors()' for more information and
'citation()' on how to cite R or R packages in publications.
Type 'demo()' for some demos, 'help()' for on-line help, or
'help.start()' for an HTML browser interface to help.
Type 'q()' to quit R.
> library(GPareto)
Loading required package: DiceKriging
Loading required package: emoa
> png(filename="/home/ddbj/snapshot/RGM3/R_CC/result/GPareto/plotParetoGrid.Rd_%03d_medium.png", width=480, height=480)
> ### Name: plotParetoGrid
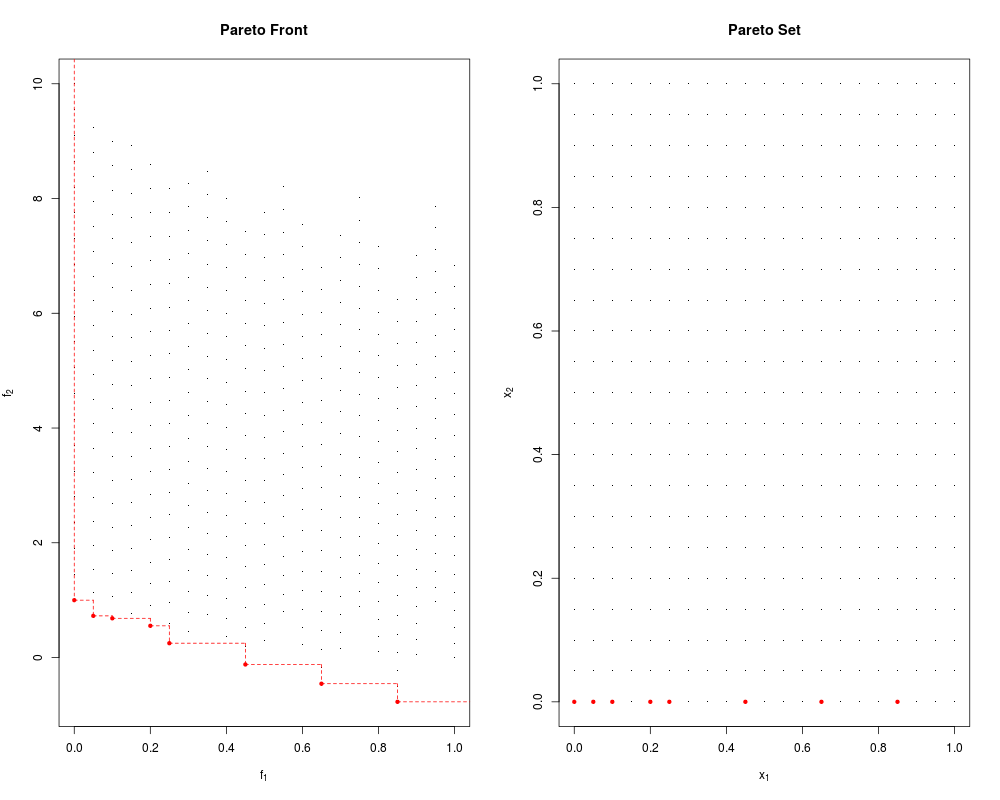
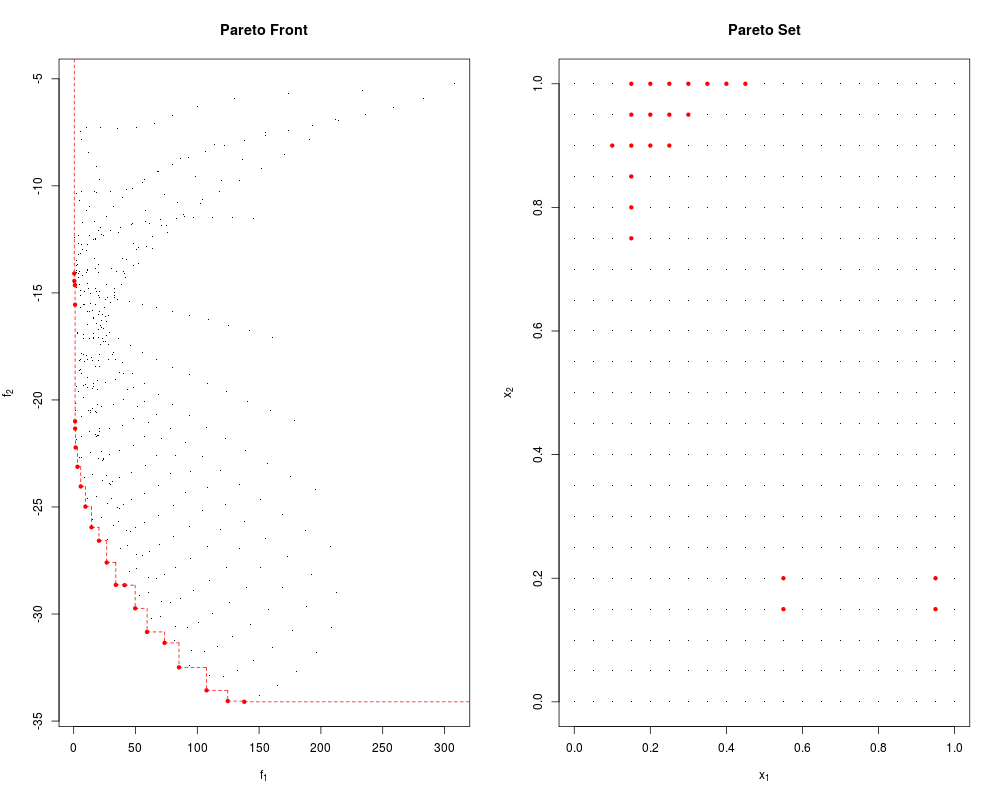
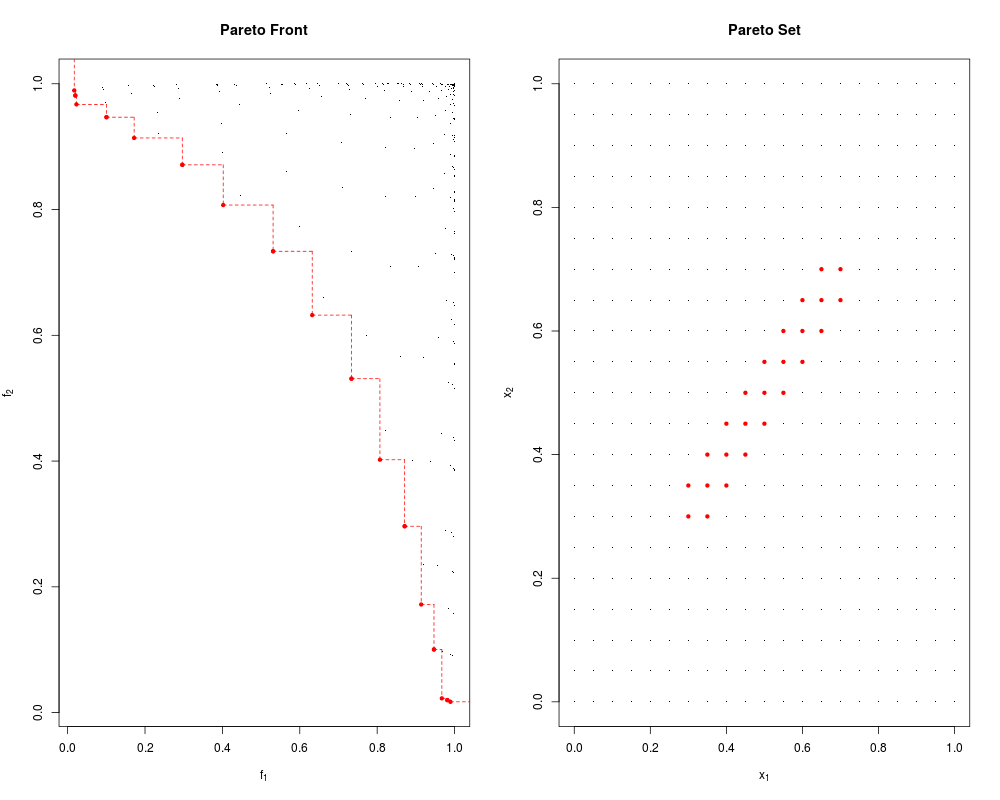
> ### Title: Visualisation of Pareto front and set
> ### Aliases: plotParetoGrid
>
> ### ** Examples
>
> #------------------------------------------------------------
> # Examples with test functions
> #------------------------------------------------------------
>
> plotParetoGrid("ZDT3", n.grid = 21)
>
> plotParetoGrid("P1", n.grid = 21)
>
> plotParetoGrid("MOP2", xlim = c(0, 1), ylim = c(0, 1), n.grid = 21)
>
>
>
>
>
> dev.off()
null device
1
>
 .
.