Supported by Dr. Osamu Ogasawara and  . . |
|
Last data update: 2014.03.03 |
Autopredict numeric or factor type variablesDescriptionFits a spatial prediction model via the Usage
## S4 method for signature 'SpatialPointsDataFrame,SpatialPixelsDataFrame'
autopredict(target, covariates,
     auto.plot=TRUE, spc=TRUE, buffer.dist=TRUE, ...)
Arguments
DetailsFor factor-type variables, classes with <5 observations are automatically removed from analysis. Generation of principal components via the Author(s)Tomislav Hengl See Also
Examples
library(sp)
library(gstat)
library(ranger)
library(plotKML)
library(raster)
## Ebergotzen data set:
data(eberg)
## subset to 10%
eberg <- eberg[runif(nrow(eberg))<.1,]
coordinates(eberg) <- ~X+Y
proj4string(eberg) <- CRS("+init=epsg:31467")
data(eberg_grid)
gridded(eberg_grid) <- ~x+y
proj4string(eberg_grid) <- CRS("+init=epsg:31467")
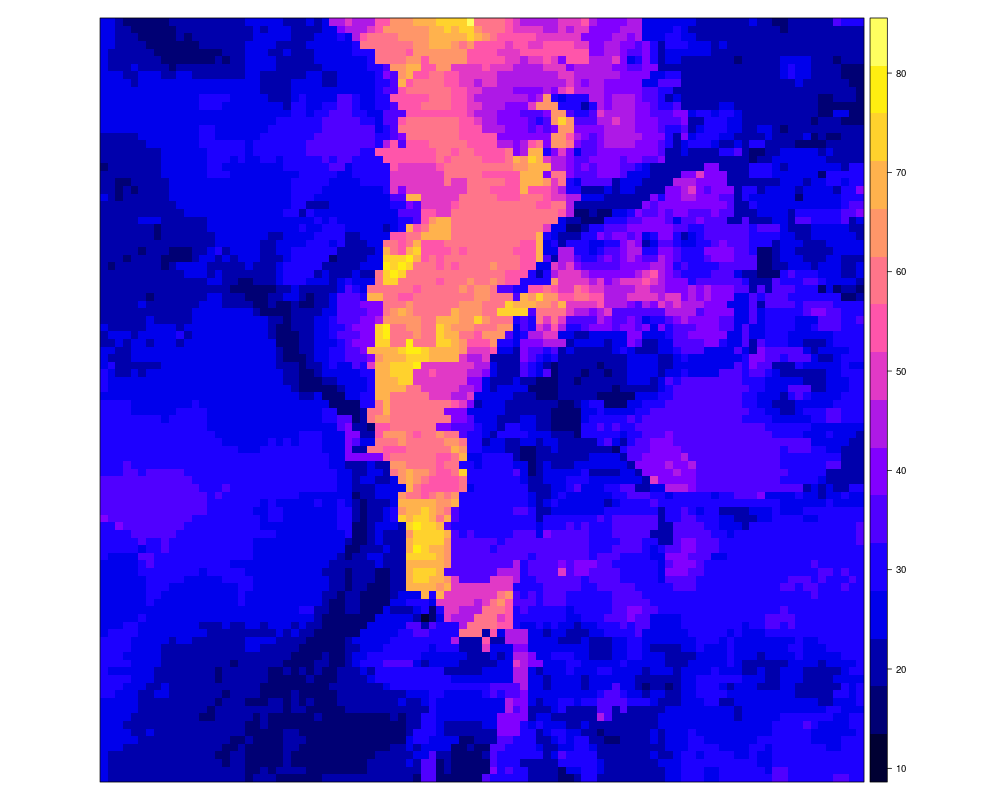
## predict sand content:
SNDMHT_A <- autopredict(eberg["SNDMHT_A"], eberg_grid,
auto.plot=FALSE)
spplot(SNDMHT_A$predicted["SNDMHT_A"])
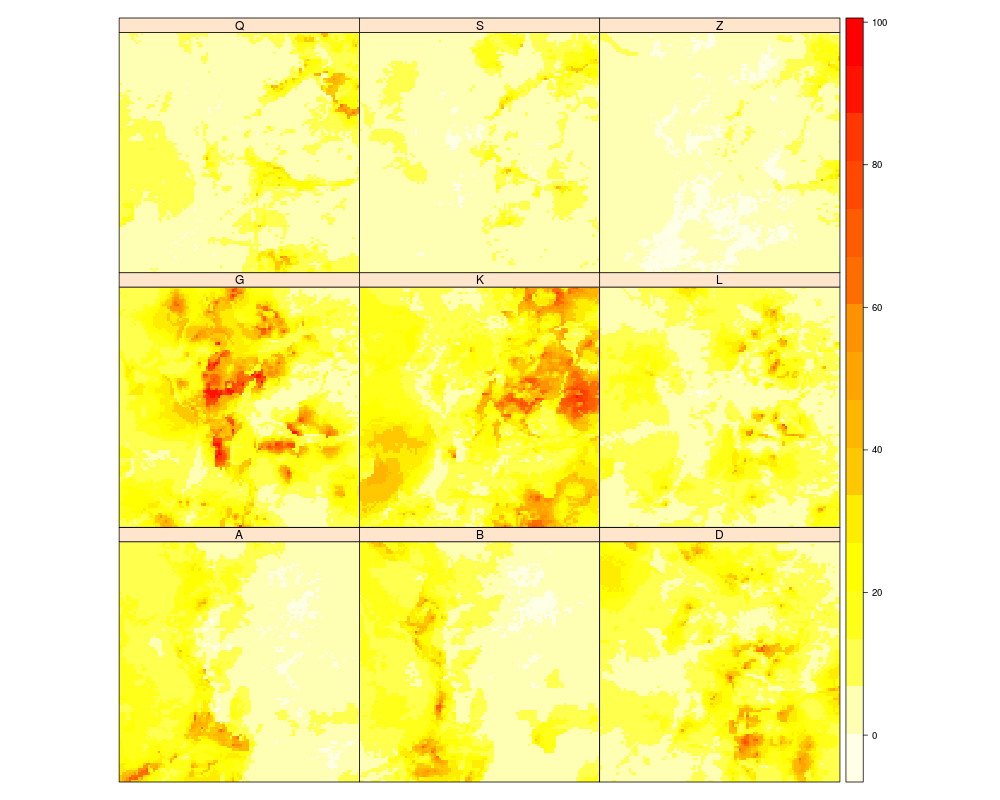
## predict soil types:
soiltype <- autopredict(eberg["soiltype"], eberg_grid,
auto.plot=FALSE)
spplot(soiltype$predicted, col.regions=R_pal[[2]])
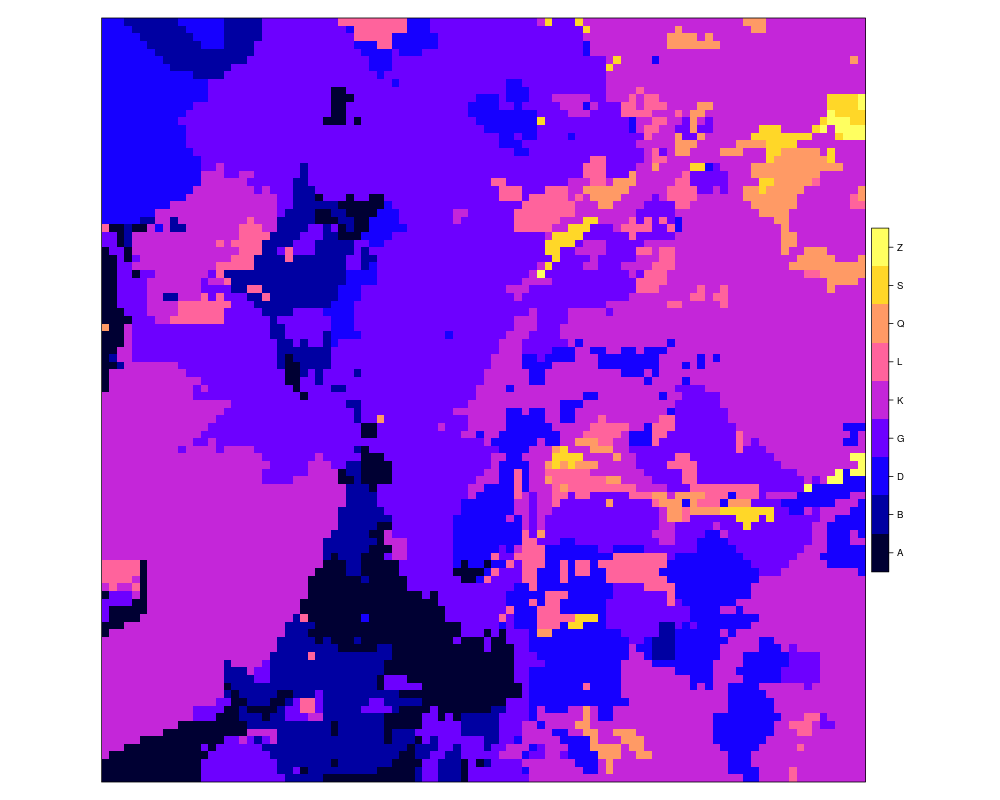
## most probable class:
eberg_grid$soiltype <- as.factor(apply(soiltype$predicted@data, 1, which.max))
levels(eberg_grid$soiltype) = names(soiltype$predicted@data)
spplot(eberg_grid["soiltype"])
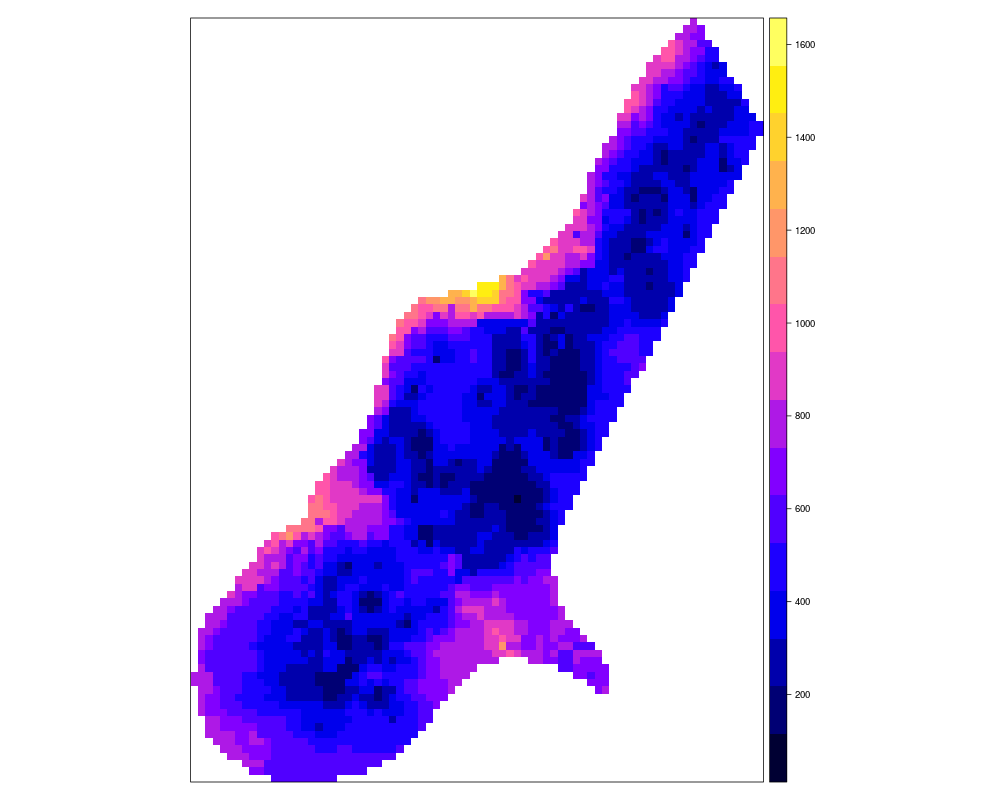
## Meuse data set:
demo(meuse, echo=FALSE)
zinc <- autopredict(meuse["zinc"], meuse.grid[c("dist","ffreq")], auto.plot=FALSE)
spplot(zinc$predicted["zinc"])
Results
R version 3.3.1 (2016-06-21) -- "Bug in Your Hair"
Copyright (C) 2016 The R Foundation for Statistical Computing
Platform: x86_64-pc-linux-gnu (64-bit)

R is free software and comes with ABSOLUTELY NO WARRANTY.
You are welcome to redistribute it under certain conditions.
Type 'license()' or 'licence()' for distribution details.

R is a collaborative project with many contributors.
Type 'contributors()' for more information and
'citation()' on how to cite R or R packages in publications.

Type 'demo()' for some demos, 'help()' for on-line help, or
'help.start()' for an HTML browser interface to help.
Type 'q()' to quit R.

> library(GSIF)
GSIF version 0.5-2 (2016-06-25)
URL: http://gsif.r-forge.r-project.org/
> png(filename="/home/ddbj/snapshot/RGM3/R_CC/result/GSIF/autopredict.Rd_%03d_medium.png", width=480, height=480)
> ### Name: autopredict-methods
> ### Title: Autopredict numeric or factor type variables
> ### Aliases: autopredict makePixels
> ###   autopredict,SpatialPointsDataFrame,SpatialPixelsDataFrame-method
>
> ### ** Examples
>
> library(sp)
> library(gstat)
> library(ranger)
> library(plotKML)
plotKML version 0.5-6 (2016-05-02)
URL: http://plotkml.r-forge.r-project.org/
> library(raster)
>
> ## Ebergotzen data set:
> data(eberg)
> ## subset to 10%
> eberg <- eberg[runif(nrow(eberg))<.1,]
> coordinates(eberg) <- ~X+Y
> proj4string(eberg) <- CRS("+init=epsg:31467")
> data(eberg_grid)
> gridded(eberg_grid) <- ~x+y
> proj4string(eberg_grid) <- CRS("+init=epsg:31467")
>
> ## predict sand content:
> SNDMHT_A <- autopredict(eberg["SNDMHT_A"], eberg_grid,
+    auto.plot=FALSE)
Generating buffer distances...
Converting PRMGEO6 to indicators...
Converting LNCCOR6 to indicators...
Converting covariates to principal components...
Fitting a randomForest model...
Warning: Shapiro-Wilk normality test and Anderson-Darling normality test report probability of < .05 indicating lack of normal distribution for residuals
Fitting a 2D variogram...
Saving an object of class 'gstatModel'...
Generating predictions using the trend model (RK method)...
Creating an object of class "SpatialPredictions"
Warning messages:
1: In prcomp.default(formula = formulaString, x) :
 extra argument 'formula' will be disregarded
2: In gstat::fit.variogram(svgm, model = ivgm, ...) :
  No convergence after 200 iterations: try different initial values?
3: In fit.variogram(object, model, fit.sills = fit.sills, fit.ranges = fit.ranges,  :
  singular model in variogram fit
> spplot(SNDMHT_A$predicted["SNDMHT_A"])
>
> ## predict soil types:
> soiltype <- autopredict(eberg["soiltype"], eberg_grid,
+   auto.plot=FALSE)
Generating buffer distances...
Converting PRMGEO6 to indicators...
Converting LNCCOR6 to indicators...
Converting covariates to principal components...
Warning message:
In prcomp.default(formula = formulaString, x) :
 extra argument 'formula' will be disregarded
> spplot(soiltype$predicted, col.regions=R_pal[[2]])
> ## most probable class:
> eberg_grid$soiltype <- as.factor(apply(soiltype$predicted@data, 1, which.max))
> levels(eberg_grid$soiltype) = names(soiltype$predicted@data)
> spplot(eberg_grid["soiltype"])
>
> ## Meuse data set:
> demo(meuse, echo=FALSE)
> zinc <- autopredict(meuse["zinc"], meuse.grid[c("dist","ffreq")], auto.plot=FALSE)
Generating buffer distances...
Converting ffreq to indicators...
Converting covariates to principal components...
Fitting a randomForest model...
Warning: Shapiro-Wilk normality test and Anderson-Darling normality test report probability of < .05 indicating lack of normal distribution for residuals
Fitting a 2D variogram...
Saving an object of class 'gstatModel'...
Subsetting observations to fit the prediction domain in 2D...
Generating predictions using the trend model (RK method)...
[using ordinary kriging]
 100% done
Running 5-fold cross validation using 'krige.cv'...
Creating an object of class "SpatialPredictions"
Warning messages:
1: In prcomp.default(formula = formulaString, x) :
 extra argument 'formula' will be disregarded
2: In gstat::fit.variogram(svgm, model = ivgm, ...) :
  No convergence after 200 iterations: try different initial values?
> spplot(zinc$predicted["zinc"])
>
>
>
>
>
> dev.off()
null device
          1
>
|