Supported by Dr. Osamu Ogasawara and  . . |
|
Last data update: 2014.03.03 |
Fits a 2D or 3D variogram model to spatial dataDescriptionFits a 2D or 3D variogram model based on a regression matrix and spatial domain of interest. Usage
## S4 method for signature 'formula,data.frame,SpatialPixelsDataFrame'
fit.vgmModel(formulaString,
      rmatrix, predictionDomain, vgmFun = "Exp",
      dimensions = list("2D", "3D", "2D+T", "3D+T"),
      anis = NULL, subsample = nrow(rmatrix), ivgm, cutoff = NULL,
      width, cressie = FALSE, ...)
Arguments
DetailsIt will try to fit a variogram to multidimensional data. If the data set is large, this process can be time-consuming, hence one way to speed up fitting is to subset the regression matrix using the Author(s)Tomislav Hengl See Also
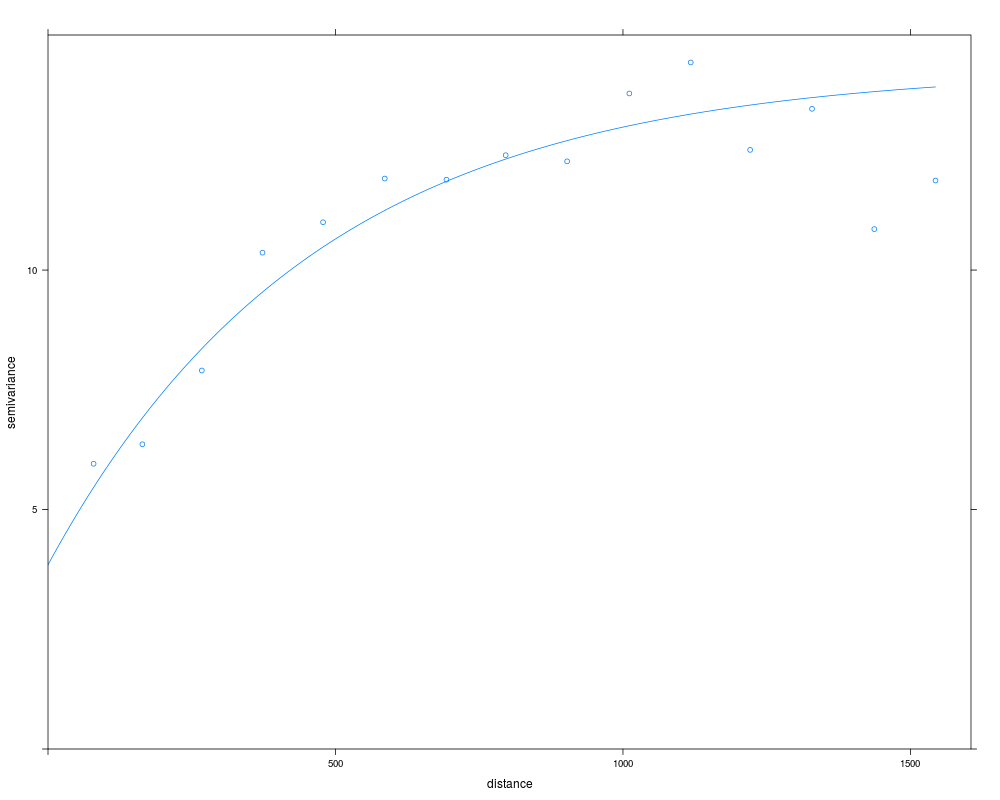
Exampleslibrary(sp) library(gstat) ## fit variogram to the Meuse data: demo(meuse, echo=FALSE) # produce a regression matrix: ov <- over(meuse, meuse.grid) ov <- cbind(data.frame(meuse["om"]), ov) # fit a model: v <- fit.vgmModel(om~1, rmatrix=ov, meuse.grid, dimensions="2D") plot(variogram(om ~ 1, meuse[!is.na(meuse$om),]), v$vgm) Results
R version 3.3.1 (2016-06-21) -- "Bug in Your Hair"
Copyright (C) 2016 The R Foundation for Statistical Computing
Platform: x86_64-pc-linux-gnu (64-bit)

R is free software and comes with ABSOLUTELY NO WARRANTY.
You are welcome to redistribute it under certain conditions.
Type 'license()' or 'licence()' for distribution details.

R is a collaborative project with many contributors.
Type 'contributors()' for more information and
'citation()' on how to cite R or R packages in publications.

Type 'demo()' for some demos, 'help()' for on-line help, or
'help.start()' for an HTML browser interface to help.
Type 'q()' to quit R.

> library(GSIF)
GSIF version 0.5-2 (2016-06-25)
URL: http://gsif.r-forge.r-project.org/
> png(filename="/home/ddbj/snapshot/RGM3/R_CC/result/GSIF/fit.vgmModel.Rd_%03d_medium.png", width=480, height=480)
> ### Name: fit.vgmModel-methods
> ### Title: Fits a 2D or 3D variogram model to spatial data
> ### Aliases: fit.vgmModel
> ###   fit.vgmModel,formula,data.frame,SpatialPixelsDataFrame-method
>
> ### ** Examples
>
> library(sp)
> library(gstat)
>
> ## fit variogram to the Meuse data:
> demo(meuse, echo=FALSE)
> # produce a regression matrix:
> ov <- over(meuse, meuse.grid)
> ov <- cbind(data.frame(meuse["om"]), ov)
> # fit a model:
> v <- fit.vgmModel(om~1, rmatrix=ov, meuse.grid, dimensions="2D")
> plot(variogram(om ~ 1, meuse[!is.na(meuse$om),]), v$vgm)
>
>
>
>
>
> dev.off()
null device
          1
>
|