Supported by Dr. Osamu Ogasawara and  . . |
|
Last data update: 2014.03.03 |
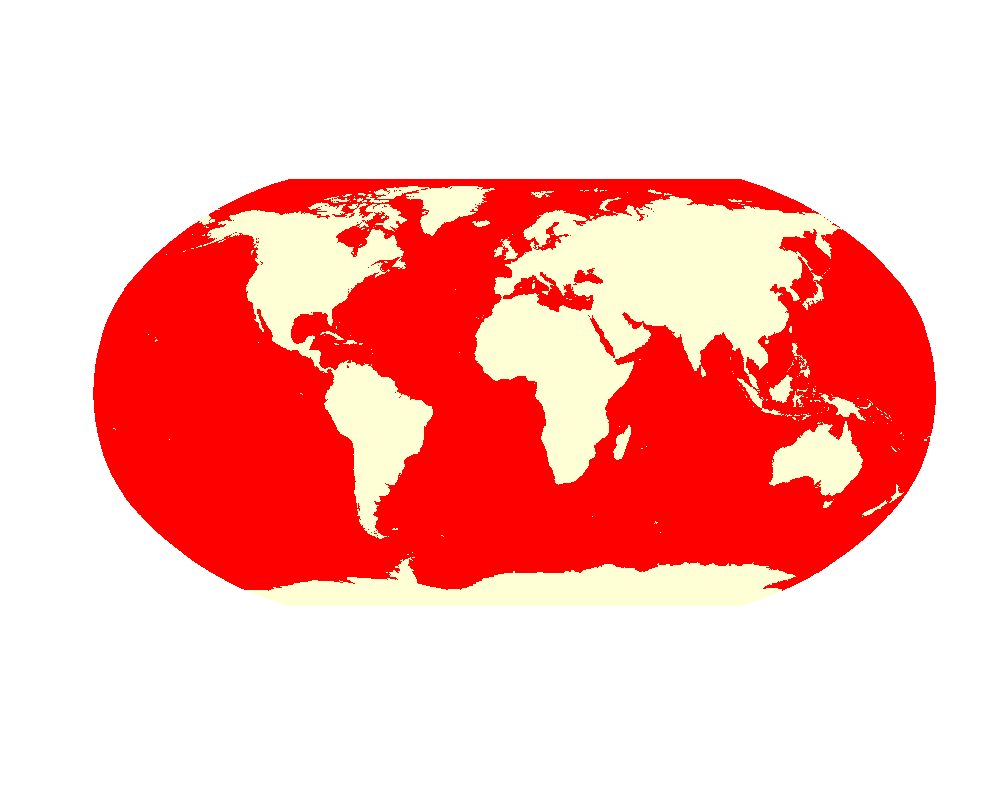
Global coarse resolution land / soil mask mapsDescriptionLand mask showing the 1-degree cells (about 19 thousand in total) in the geographical coordinates, and the productive soils mask (areas with a positive Leaf Area Index at least once in the period 2002–2011). The land mask is based on the Global Self-consistent, Hierarchical, High-resolution Shoreline Database data (GSHHS 2.1), the productive soils mask on the MODIS Leaf Area Index monthtly product (MOD15A2), and the water mask is based on the MOD44W product. The map of the Keys to Soil Taxonomy soil suborders of the world at 20 km is based on the USDA-NRCS map of the global soil regions. Usagedata(landmask) Format
NoteThe land mask has been generated from the layer References
See Also
Examples
library(rgdal)
library(sp)

data(landmask)
gridded(landmask) <- ~x+y
proj4string(landmask) <- "+proj=longlat +datum=WGS84"
## Not run:  ## plot maps:
library(maps)
country.m = map('world', plot=FALSE, fill=TRUE)
IDs <- sapply(strsplit(country.m$names, ":"), function(x) x[1])
library(maptools)
country <- as(map2SpatialPolygons(country.m, IDs=IDs), "SpatialLines")
spplot(landmask["mask"], col.regions="grey", sp.layout=list("sp.lines", country))
spplot(landmask["soilmask"], col.regions="grey", sp.layout=list("sp.lines", country))

## End(Not run)
## also available in the Robinson projection at 20 km grid:
data(landmask20km)
image(landmask20km[1])
summary(landmask20km$suborder)
summary(landmask20km$soilmask)
Results
R version 3.3.1 (2016-06-21) -- "Bug in Your Hair"
Copyright (C) 2016 The R Foundation for Statistical Computing
Platform: x86_64-pc-linux-gnu (64-bit)

R is free software and comes with ABSOLUTELY NO WARRANTY.
You are welcome to redistribute it under certain conditions.
Type 'license()' or 'licence()' for distribution details.

R is a collaborative project with many contributors.
Type 'contributors()' for more information and
'citation()' on how to cite R or R packages in publications.

Type 'demo()' for some demos, 'help()' for on-line help, or
'help.start()' for an HTML browser interface to help.
Type 'q()' to quit R.

> library(GSIF)
GSIF version 0.5-2 (2016-06-25)
URL: http://gsif.r-forge.r-project.org/
> png(filename="/home/ddbj/snapshot/RGM3/R_CC/result/GSIF/landmask.Rd_%03d_medium.png", width=480, height=480)
> ### Name: landmask
> ### Title: Global coarse resolution land / soil mask maps
> ### Aliases: landmask landmask20km
> ### Keywords: datasets
>
> ### ** Examples
>
> library(rgdal)
Loading required package: sp
rgdal: version: 1.1-10, (SVN revision 622)
 Geospatial Data Abstraction Library extensions to R successfully loaded
 Loaded GDAL runtime: GDAL 1.11.3, released 2015/09/16
 Path to GDAL shared files: /usr/share/gdal/1.11
 Loaded PROJ.4 runtime: Rel. 4.9.2, 08 September 2015, [PJ_VERSION: 492]
 Path to PROJ.4 shared files: (autodetected)
 Linking to sp version: 1.2-3
> library(sp)
>
> data(landmask)
> gridded(landmask) <- ~x+y
> proj4string(landmask) <- "+proj=longlat +datum=WGS84"
> ## Not run:
> ##D  ## plot maps:
> ##D library(maps)
> ##D country.m = map('world', plot=FALSE, fill=TRUE)
> ##D IDs <- sapply(strsplit(country.m$names, ":"), function(x) x[1])
> ##D library(maptools)
> ##D country <- as(map2SpatialPolygons(country.m, IDs=IDs), "SpatialLines")
> ##D spplot(landmask["mask"], col.regions="grey", sp.layout=list("sp.lines", country))
> ##D spplot(landmask["soilmask"], col.regions="grey", sp.layout=list("sp.lines", country))
> ## End(Not run)
> ## also available in the Robinson projection at 20 km grid:
> data(landmask20km)
> image(landmask20km[1])
> summary(landmask20km$suborder)
        Ocean Shifting Sand          Rock           Ice       Histels
       937025         11898          4333         28031          3131
      Turbels       Orthels      Fibrists       Hemists      Saprists
        16210         16250           560          2767           692
       Aquods        Cryods        Humods       Orthods        Gelods
          475          7408           126          1758          3359
      Cryands      Torrands      Xerrands      Vitrands       Ustands
          669             2            82           601           145
       Udands       Gelands         Aquox        Torrox         Ustox
          605           179           660            66          6446
        Perox          Udox       Aquerts       Cryerts       Xererts
         2414         10803            11            48           244
     Torrerts       Usterts        Uderts        Cryids        Salids
         1965          3809           854          2646          3013
      Gypsids        Argids       Calcids       Cambids       Aquults
         1519         10913         10973          6625          2719
      Humults        Udults       Ustults       Xerults       Albolls
          824         12066          6967            41            18
      Aquolls      Rendolls       Xerolls       Cryolls       Ustolls
          300           602          2295          6561          9809
       Udolls       Gelolls       Aqualfs       Cryalfs       Ustalfs
         3041           409          2378          7104         13033
      Xeralfs        Udalfs        Udepts       Gelepts       Aquepts
         2146          6355          9425         17586          9265
    Anthrepts       Cryepts       Ustepts       Xerepts          NA's
          930          6797          4942          1669        241366
> summary(landmask20km$soilmask)
            bare soil areas soils with vegetation cover
                      37809                      274606
                urban areas                        NA's
                       1529                     1154019
>
>
>
>
>
> dev.off()
null device
          1
>
|