R: Estimate the expected species abundance distribution of both...
expected.SAD.Guilds
R Documentation
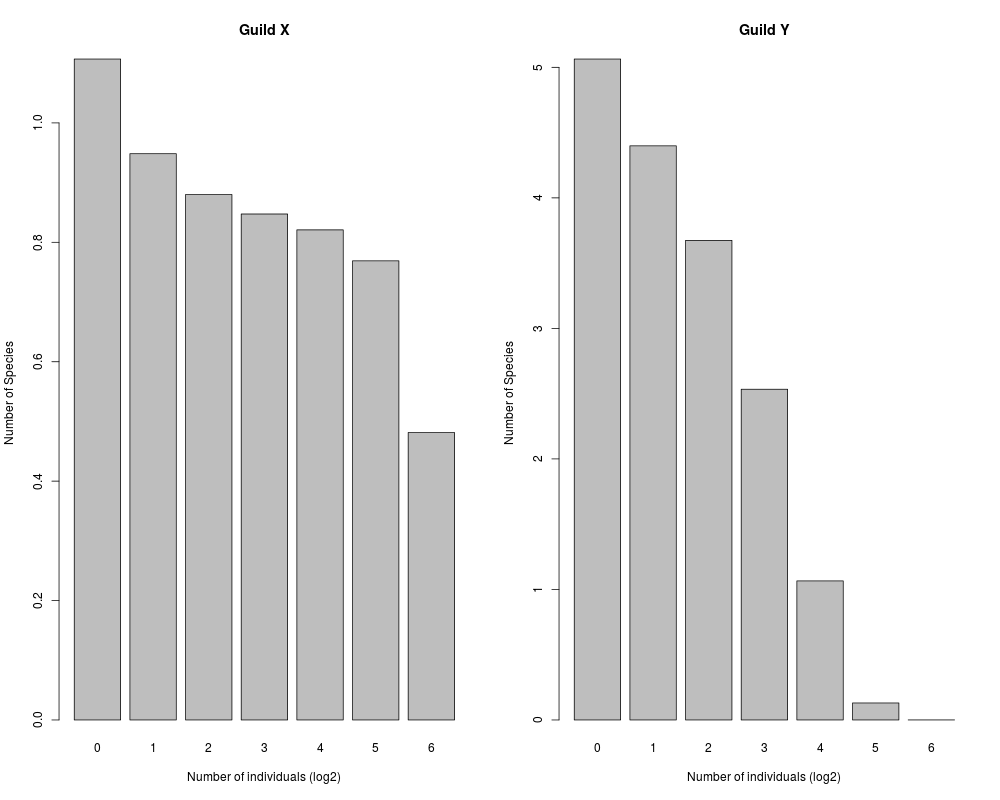
Estimate the expected species abundance distribution of both guilds using the guilds model, provided theta, alpha_x, alpha_y and J.
Description
This function estimates the expected species abundance distribution of both guilds using the guilds model, provided theta, alpha_x, alpha_y and J. The expected species abundance distribution is approximated by first drawing px from a beta distribution (equation 4 in Janzen et al. 2014). Then, guild sizes are drawn using equation 3 in Janzen et al. 2014. Because the abundance distributions of the two guilds are independent, the distributions can now be obtained using equation 6 in Etienne and Alonso 2005. Because drawing from the beta distribution and equation 3 is inherently stochastic, this function returns the average over a specified number of replicates.
Total number of individuals in the local community, e.g. J = Jx + Jy
n_replicates
Number of replicates to use to estimate the abundance distributions.
Value
guildX
Vector containing the mean abundances of species in Guild X, binned into log2 bins
guildY
Vector containing the mean abundances of species in Guild Y, binned into log2 bins
Author(s)
Thijs Janzen & Bart Haegeman
References
Etienne, R.S., & Alonso, D. (2005). A dispersal-limited sampling theory for species and alleles. Ecology Letters, 8(100), 1147-1156.
Examples
  SADs <- expected.SAD.Guilds(theta=42, alpha_x=0.01, alpha_y=0.1, J=200, n_replicates = 1)
  par(mfrow=c(1,2));
  barplot(SADs$guildX,names.arg=0:(length(SADs$guildX)-1),
	  xlab="Number of individuals (log2)",
	  ylab="Number of Species",main="Guild X" )

  barplot(SADs$guildY,names.arg=0:(length(SADs$guildY)-1),
	  xlab="Number of individuals (log2)",
	  ylab="Number of Species",main="Guild Y" )
Results
R version 3.3.1 (2016-06-21) -- "Bug in Your Hair"
Copyright (C) 2016 The R Foundation for Statistical Computing
Platform: x86_64-pc-linux-gnu (64-bit)

R is free software and comes with ABSOLUTELY NO WARRANTY.
You are welcome to redistribute it under certain conditions.
Type 'license()' or 'licence()' for distribution details.

R is a collaborative project with many contributors.
Type 'contributors()' for more information and
'citation()' on how to cite R or R packages in publications.

Type 'demo()' for some demos, 'help()' for on-line help, or
'help.start()' for an HTML browser interface to help.
Type 'q()' to quit R.

> library(GUILDS)
> png(filename="/home/ddbj/snapshot/RGM3/R_CC/result/GUILDS/expected.SAD.Guilds.Rd_%03d_medium.png", width=480, height=480)
> ### Name: expected.SAD.Guilds
> ### Title: Estimate the expected species abundance distribution of both
> ###   guilds using the guilds model, provided theta, alpha_x, alpha_y and
> ###   J.
> ### Aliases: expected.SAD.Guilds
>
> ### ** Examples
>
>   SADs <- expected.SAD.Guilds(theta=42, alpha_x=0.01, alpha_y=0.1, J=200, n_replicates = 1)
>   par(mfrow=c(1,2));
>   barplot(SADs$guildX,names.arg=0:(length(SADs$guildX)-1),
+ 	  xlab="Number of individuals (log2)",
+ 	  ylab="Number of Species",main="Guild X" )
>
>   barplot(SADs$guildY,names.arg=0:(length(SADs$guildY)-1),
+ 	  xlab="Number of individuals (log2)",
+ 	  ylab="Number of Species",main="Guild Y" )
>
>
>
>
>
>
> dev.off()
null device
          1
>
 .
.