Supported by Dr. Osamu Ogasawara and  . . |
|
Last data update: 2014.03.03 |
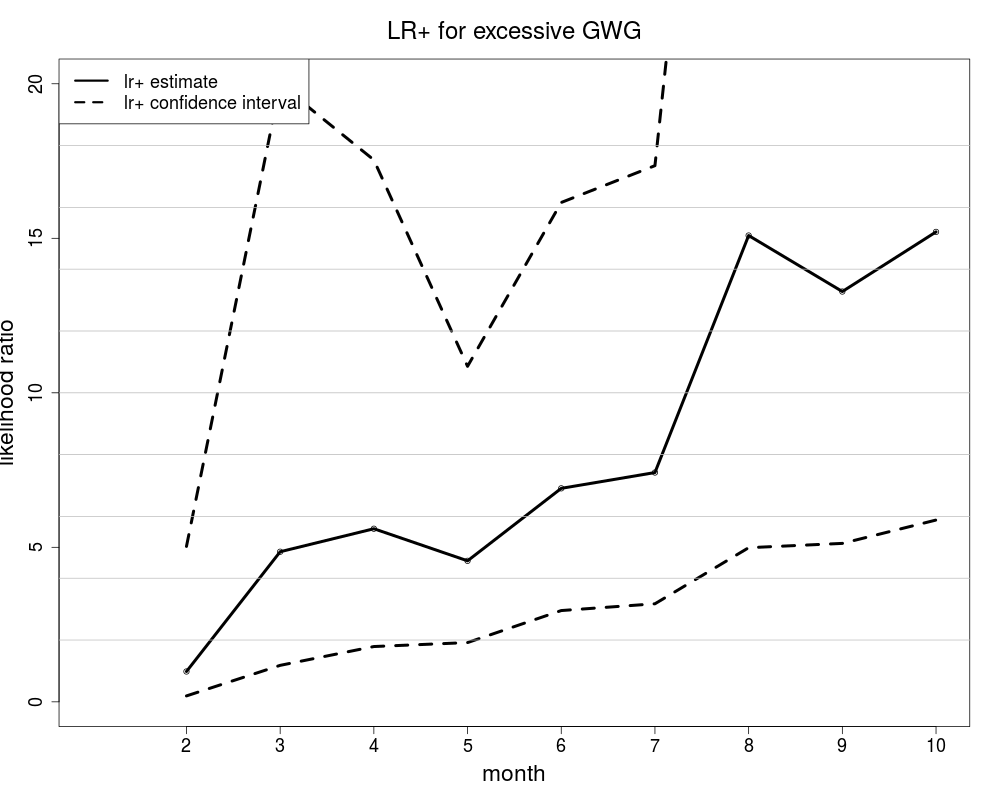
Sensitivity, specificity, positive and negative likelihood ratios for prediction of excessive GWG for obese womenDescriptionThis dataset include the sensitivity and specificity for prediction of excessive GWG at the end of pregnancy from exceeding the respective cut-off values in each respective month as well as the likelihood ratio to assess how much the information on exceeding the cut-off values improves the a priori probabilities for excessive and adequate total GWG for obese women (starting with the 2nd month or week 4/1-8/0). The data is based on 186 obese women from two German cohorts (see Description). Usagedata("OB_above")
FormatA data frame with 9 observations on the following 13 variables.
DetailsExact binomial 95% confidence intervals (CI) were calculated for sensitivity and specificity and the 95% CI of the likelihood ratios were calculated as suggested by Simel et al. (1991). SourceKnabl J, Riedel C, Gmach J et al. (2013). Prediction of excessive or inadequate gestational weight gain from week-specific IOM/NRC cut-off values. submitted. ReferencesSimel D, Samsa G, Matchar D (1991). Likelihood ratios with confidence: Sample size estimation for diagnostic test studies. Journal of Clinical Epidemiology 44.p 763 - 770. Examples
data("OB_above")

#Plot of positive likelihood ratios for excessive GWG for obese women
plot(OB_above$month, OB_above$lr.pos.est,
     xlim=c(1,10),
     ylim=c(0,20),
     main="LR+ for excessive GWG",
     ylab="likelihood ratio",
     xlab="month",
     cex.main=2,
     font.main=1,
     cex.lab=1.9,
     cex.axis=1.5)
lines(OB_above$month, OB_above$lr.pos.est, lty=1,lwd=4)
lines(OB_above$month, OB_above$lr.pos.lower, lty=2,lwd=4)
lines(OB_above$month, OB_above$lr.pos.upper, lty=2,lwd=4)
abline(h=2,lwd=1, col="grey")
abline(h=4,lwd=1, col="grey")
abline(h=6,lwd=1, col="grey")
abline(h=8,lwd=1, col="grey")
abline(h=10,lwd=1, col="grey")
abline(h=12,lwd=1, col="grey")
abline(h=14,lwd=1, col="grey")
abline(h=16,lwd=1, col="grey")
abline(h=18,lwd=1, col="grey")
axis(1, c(3,5,7,9), cex.axis=1.5)
legend("topleft", c("lr+ estimate", "lr+ confidence interval"),
       col=c("black", "black"), lty=c(1,2),
       bg="white", cex=1.5, lwd=c(3,3))
Results
R version 3.3.1 (2016-06-21) -- "Bug in Your Hair"
Copyright (C) 2016 The R Foundation for Statistical Computing
Platform: x86_64-pc-linux-gnu (64-bit)

R is free software and comes with ABSOLUTELY NO WARRANTY.
You are welcome to redistribute it under certain conditions.
Type 'license()' or 'licence()' for distribution details.

R is a collaborative project with many contributors.
Type 'contributors()' for more information and
'citation()' on how to cite R or R packages in publications.

Type 'demo()' for some demos, 'help()' for on-line help, or
'help.start()' for an HTML browser interface to help.
Type 'q()' to quit R.

> library(GWG)
> png(filename="/home/ddbj/snapshot/RGM3/R_CC/result/GWG/OB_above.Rd_%03d_medium.png", width=480, height=480)
> ### Name: OB_above
> ### Title: Sensitivity, specificity, positive and negative likelihood
> ###   ratios for prediction of excessive GWG for obese women
> ### Aliases: OB_above
> ### Keywords: datasets
>
> ### ** Examples
>
> data("OB_above")
>
> #Plot of positive likelihood ratios for excessive GWG for obese women
> plot(OB_above$month, OB_above$lr.pos.est,
+      xlim=c(1,10),
+      ylim=c(0,20),
+      main="LR+ for excessive GWG",
+      ylab="likelihood ratio",
+      xlab="month",
+      cex.main=2,
+      font.main=1,
+      cex.lab=1.9,
+      cex.axis=1.5)
> lines(OB_above$month, OB_above$lr.pos.est, lty=1,lwd=4)
> lines(OB_above$month, OB_above$lr.pos.lower, lty=2,lwd=4)
> lines(OB_above$month, OB_above$lr.pos.upper, lty=2,lwd=4)
> abline(h=2,lwd=1, col="grey")
> abline(h=4,lwd=1, col="grey")
> abline(h=6,lwd=1, col="grey")
> abline(h=8,lwd=1, col="grey")
> abline(h=10,lwd=1, col="grey")
> abline(h=12,lwd=1, col="grey")
> abline(h=14,lwd=1, col="grey")
> abline(h=16,lwd=1, col="grey")
> abline(h=18,lwd=1, col="grey")
> axis(1, c(3,5,7,9), cex.axis=1.5)
> legend("topleft", c("lr+ estimate", "lr+ confidence interval"),
+        col=c("black", "black"), lty=c(1,2),
+        bg="white", cex=1.5, lwd=c(3,3))
>
>
>
>
>
> dev.off()
null device
          1
>
|