Supported by Dr. Osamu Ogasawara and  . . |
|
Last data update: 2014.03.03 |
Estimating Genome-Wide Significance for Whole Genome Sequencing Studies, Either Single SNP Tests or Region-Based TestsDescriptionThe correlations and linkage disequilibrium between tests can vary as a function of minor allele frequency thresholds used to filter variants, and also varies with different choices of test statistic for region-based tests. Appropriate genome-wide significance thresholds can be estimated empirically through permutation on only a small proportion of the whole genome. UsageGWsignif(pvalues, ntest.genome, K = 5, alpha = 0.05, plot.figure = TRUE) Arguments
DetailsThe function estimates the significance threshold needed to control the family-wise error rate (FWER) for a large number of tests, based on an extrapolation approach described in Xu et al. 2014, Genetic Epidemiology 38(4): 281-290. The required input is a set of p-values obtained via permutation, for a subset of the total number of tests to be performed. The tests used for permutation should lie on the same chromosome and be ordered by position in the input matrix; permutations should be performed to maintain the correlation structure between the genetic data, i.e. by permuting the phenotype and then repeating all analyses along the chromosome. To give an example, suppose there are m=500,000 tests to be performed on one chromosome, and 10 million tests to be performed genome-wide. A significance threshold controlling FWER at 0.05 is desired. GWsignif will divide the m=500,000 tests into 2^(k-1) subset(s) of approximately equal size, each consisting of m/(2^(k-1)) tests, for k=1,2,...,K. Ideally, K should be chosen such that there are still several thousand tests in the smallest subset. For example, if K=8, then m/(2^(K-1)) = 3906.25. The 500,000 tests will therefore be divided into 128 sets of approximately 3906 tests, then 64 sets of 7812 tests (2*3906), etc., and finally 2 sets of 250,000 tests and one set of 500,000 tests. Within each of these sets, and for each permutation, the minimum p-value is calculated, and the alpha percentile of these minimum p-values is then estimated across the permutations. (There should be sufficient permutations to estimate the alpha-th percentile with some accuracy). It is then possible to fit a regression line between the naive Bonferroni threshold that would be required for m/(2^(k-1)) tests and the alpha percentile of the minimum p-values (on the negative log10 scale); this line is then used for extrapolation. Value
Author(s)ChangJiang Xu, Celia M.T. Greenwood ReferencesChangJiang Xu, Ioanna Tachmazidou, Klaudia Walter, Antonio Ciampi, Eleftheria Zeggini, Celia M.T. Greenwood (2014) Estimating genome-wide significance for whole genome sequencing studies. Genetic Epidemiology Examplespvalues <- matrix(runif(1000*5000), 1000) gw <- GWsignif(pvalues, alpha = 0.05) gw <- GWsignif(pvalues, ntest.genome = 50000, K = 5, alpha = 0.05) Results
R version 3.3.1 (2016-06-21) -- "Bug in Your Hair"
Copyright (C) 2016 The R Foundation for Statistical Computing
Platform: x86_64-pc-linux-gnu (64-bit)
R is free software and comes with ABSOLUTELY NO WARRANTY.
You are welcome to redistribute it under certain conditions.
Type 'license()' or 'licence()' for distribution details.
R is a collaborative project with many contributors.
Type 'contributors()' for more information and
'citation()' on how to cite R or R packages in publications.
Type 'demo()' for some demos, 'help()' for on-line help, or
'help.start()' for an HTML browser interface to help.
Type 'q()' to quit R.
> library(GWsignif)
> png(filename="/home/ddbj/snapshot/RGM3/R_CC/result/GWsignif/GWsignif.Rd_%03d_medium.png", width=480, height=480)
> ### Name: GWsignif
> ### Title: Estimating Genome-Wide Significance for Whole Genome Sequencing
> ### Studies, Either Single SNP Tests or Region-Based Tests
> ### Aliases: GWsignif
>
> ### ** Examples
>
> pvalues <- matrix(runif(1000*5000), 1000)
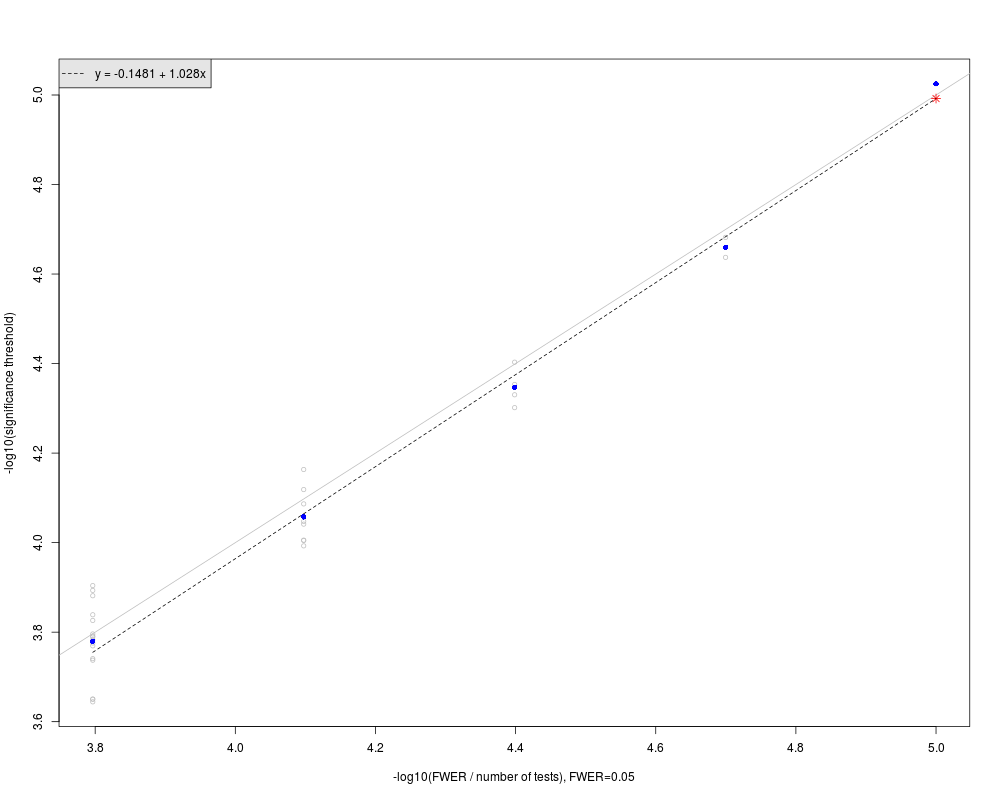
> gw <- GWsignif(pvalues, alpha = 0.05)
The number of tests in a large genome-wide region of interest: ntest.genome=5000.
The significance threshold in the large genome-wide region: GWsignif.threshold=1.00824e-05.
--------------
In the figure:
Gray circles represent sub-regions significance thresholds.
Blue dots are the mean of -log10(significance thresholds) in the sub-regions of same size.
Red star represents the extrapolated significance threshold in a large genome-wide region of interest.
The dashed line is fit to the blue solid dots. The grey line is the line of equality, y=x.
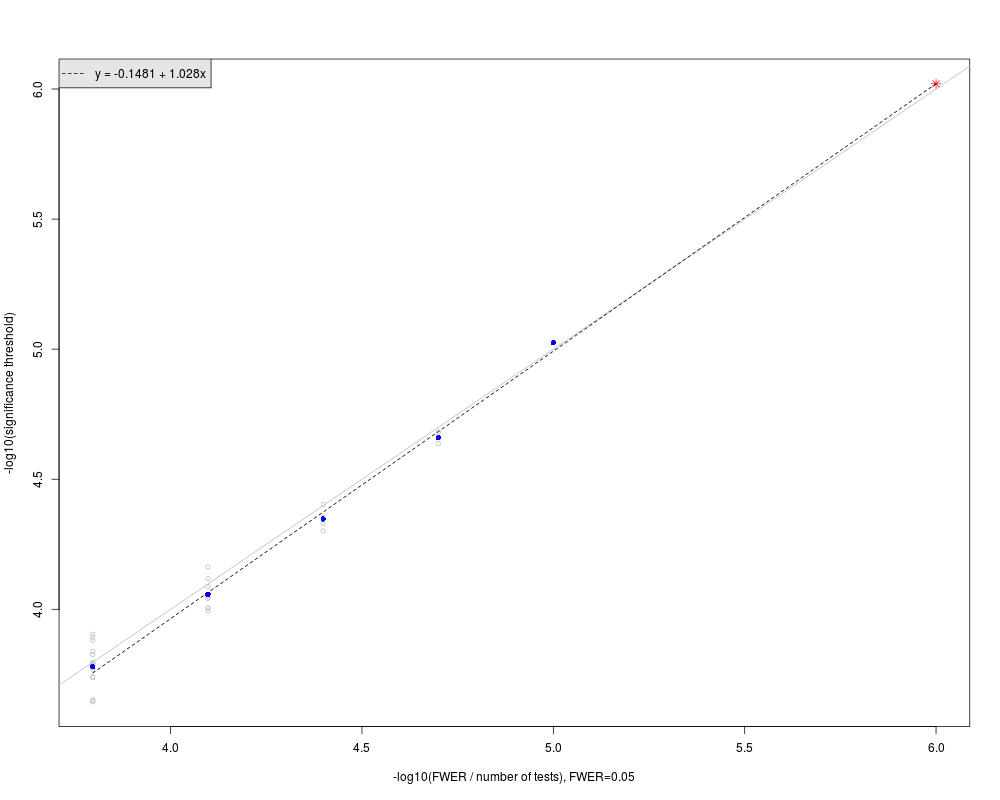
> gw <- GWsignif(pvalues, ntest.genome = 50000, K = 5, alpha = 0.05)
The number of tests in a large genome-wide region of interest: ntest.genome=50000.
The significance threshold in the large genome-wide region: GWsignif.threshold=9.54346e-07.
--------------
In the figure:
Gray circles represent sub-regions significance thresholds.
Blue dots are the mean of -log10(significance thresholds) in the sub-regions of same size.
Red star represents the extrapolated significance threshold in a large genome-wide region of interest.
The dashed line is fit to the blue solid dots. The grey line is the line of equality, y=x.
>
>
>
>
>
> dev.off()
null device
1
>
|