R: Functions characterizing the Gaussian Diffusion process X(t)...
builtfunc
R Documentation
Functions characterizing the Gaussian Diffusion process X(t) and the considered threshold
Description
builtfunc evaluates all the functions describing a generic Gaussian Diffusion process X(t) (drift, infinitesimal variance, mean, variance and first derivative of the transition density); it also evaluates the threshold function and its time derivative, both required in the evaluation of the kernel function of the Volterra integral equation for the FPT pdf (Buonocore 1987).
gives the infinitesimal variance of the process as cc(t)
S
gives the threshold
Sp
gives the threshold time derivative
mdt
gives the mean of the transition pdf of the process
vdt
gives the variance of the transition pdf of the process
fdt
gives the transition pdf of the process
psi
gives the kernel for evaluating the FPT pdf of the process via numerical integration of the Volterra integral equation
Author(s)
A. Buonocore, M.F. Carfora
Examples
##---- Should be DIRECTLY executable !! ----
##-- ==> Define data, use random,
##-- or do help(data=index) for the standard data sets.
delta <- 0.5
time.vec <- seq(0, by=delta, 100)
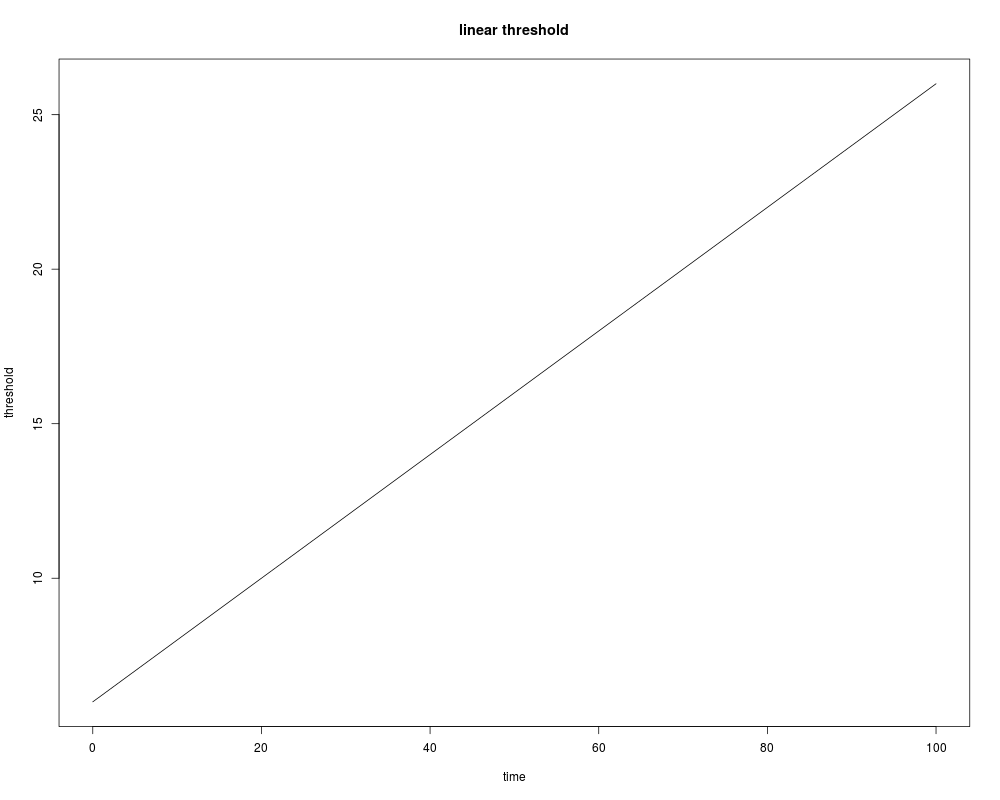
# linear threshold
Scost <- 6
Sslope <- 0.2
# user provided function (see examples in demo folder)
SSS <- function(t) {
SSS <- Scost + Sslope*t
}
Slin <- S(time.vec)
plot(time.vec,Slin,type='l',xlab='time',ylab='threshold',main='linear threshold')
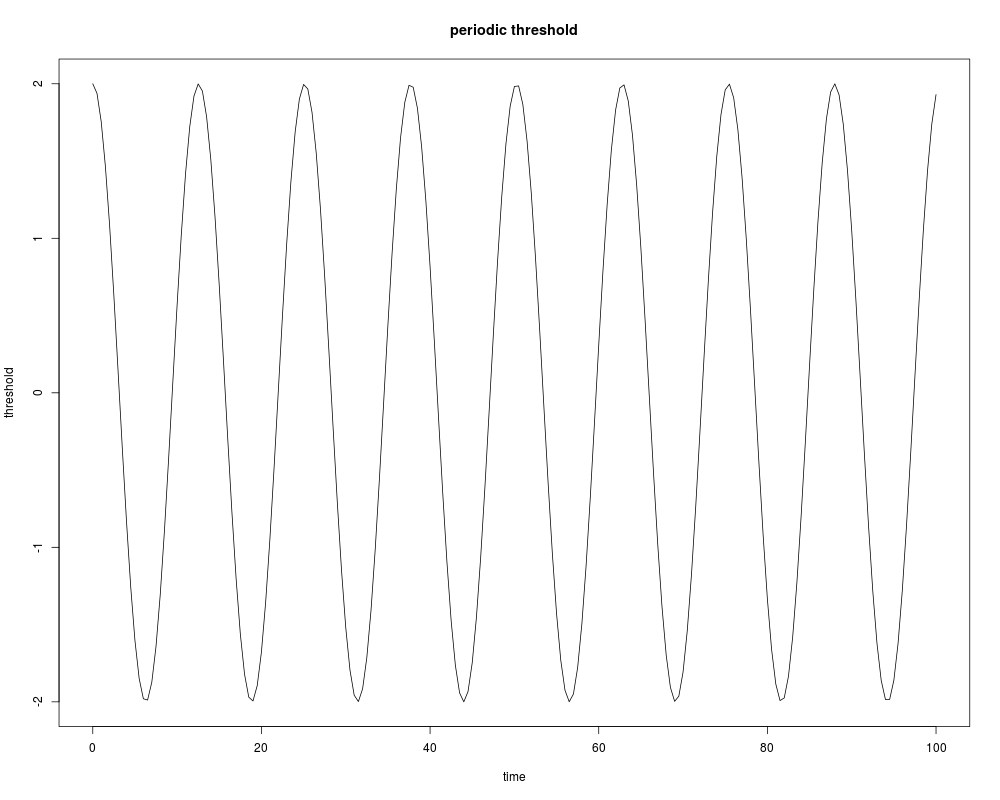
# periodic threshold
S0 <- 0
S1 <- 2
Sfr <- 0.5
# user provided function (see examples in demo folder)
SSS <- function(t) {
SSS <- S1*cos(Sfr*t+S0)
}
Sper <- S(time.vec)
plot(time.vec,Sper,type='l',xlab='time',ylab='threshold',main='periodic threshold')
Results
R version 3.3.1 (2016-06-21) -- "Bug in Your Hair"
Copyright (C) 2016 The R Foundation for Statistical Computing
Platform: x86_64-pc-linux-gnu (64-bit)

R is free software and comes with ABSOLUTELY NO WARRANTY.
You are welcome to redistribute it under certain conditions.
Type 'license()' or 'licence()' for distribution details.

R is a collaborative project with many contributors.
Type 'contributors()' for more information and
'citation()' on how to cite R or R packages in publications.

Type 'demo()' for some demos, 'help()' for on-line help, or
'help.start()' for an HTML browser interface to help.
Type 'q()' to quit R.

> library(GaDiFPT)
> png(filename="/home/ddbj/snapshot/RGM3/R_CC/result/GaDiFPT/builtfunc.Rd_%03d_medium.png", width=480, height=480)
> ### Name: builtfunc
> ### Title: Functions characterizing the Gaussian Diffusion process X(t) and
> ###   the considered threshold
> ### Aliases: builtfunc a b cc S Sp a1 a2 mdt vdt fdt psi
>
> ### ** Examples
>
> ##---- Should be DIRECTLY executable !! ----
> ##-- ==>  Define data, use random,
> ##--	or do  help(data=index)  for the standard data sets.
>
>
> delta <- 0.5
> time.vec <- seq(0, by=delta, 100)
>
> # linear threshold
> Scost <- 6
> Sslope <- 0.2
> # user provided function (see examples in demo folder)
> SSS <- function(t) {
+   SSS <- Scost + Sslope*t
+ }
> Slin <- S(time.vec)
> plot(time.vec,Slin,type='l',xlab='time',ylab='threshold',main='linear threshold')
>
> # periodic threshold
> S0 <- 0
> S1 <- 2
> Sfr <- 0.5
> # user provided function (see examples in demo folder)
> SSS <- function(t) {
+   SSS <- S1*cos(Sfr*t+S0)
+ }
> Sper <- S(time.vec)
> plot(time.vec,Sper,type='l',xlab='time',ylab='threshold',main='periodic threshold')
>
>
>
>
>
> dev.off()
null device
          1
>
 .
.