Displays a graph with a Lorenz curve for each confliciting claims rule.
Usage
LorenzRules(x)
Arguments
x
Output object from AllRules
Examples
## replication of Gallastegui et al. (2003), Table 7.
CLAIMS <- c(158,299,927,2196,4348,6256,13952)
COUNTRIES <- c("Germany","Netherlands","Belgium","Ireland","UK","Spain","France")
INARRA <- AllRules(13500,CLAIMS,COUNTRIES)
summary(INARRA)
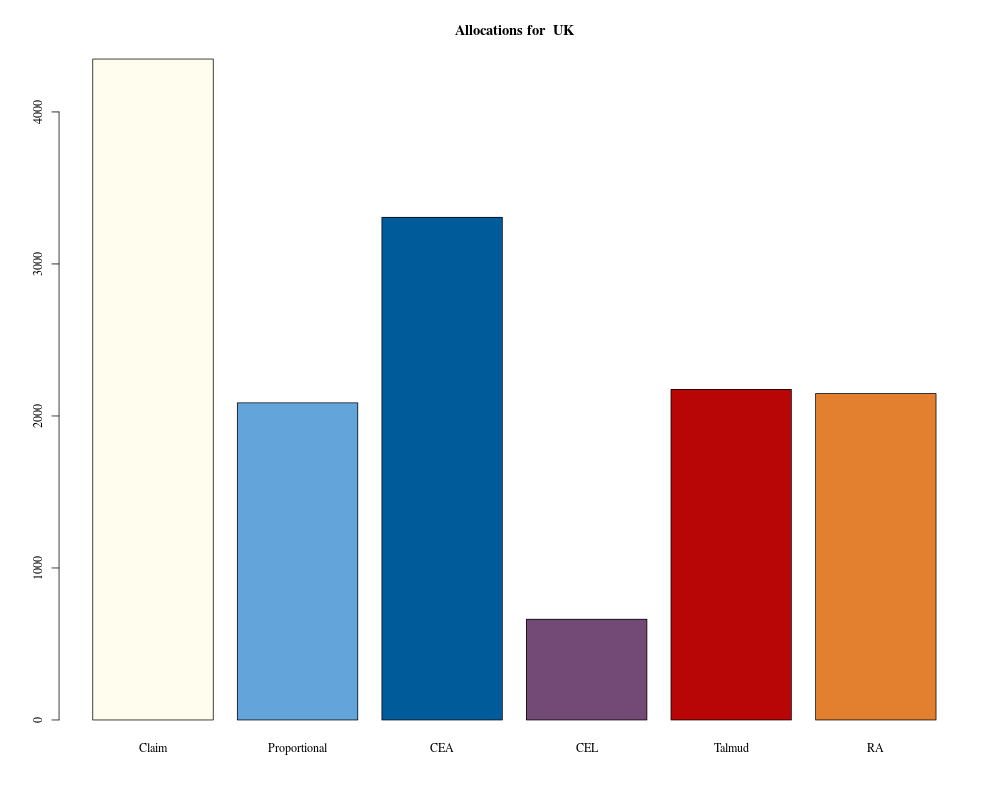
plot(INARRA,5) ## Display allocations for UK
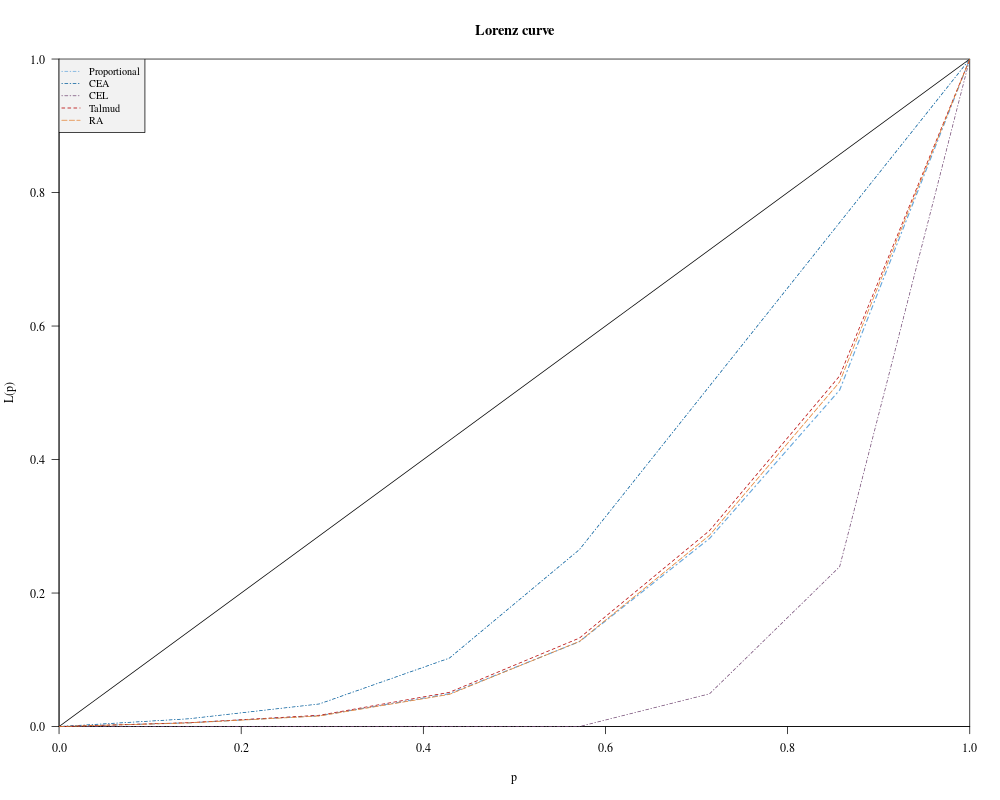
LorenzRules(INARRA) ## Inequality graph
Results
R version 3.3.1 (2016-06-21) -- "Bug in Your Hair"
Copyright (C) 2016 The R Foundation for Statistical Computing
Platform: x86_64-pc-linux-gnu (64-bit)

R is free software and comes with ABSOLUTELY NO WARRANTY.
You are welcome to redistribute it under certain conditions.
Type 'license()' or 'licence()' for distribution details.

R is a collaborative project with many contributors.
Type 'contributors()' for more information and
'citation()' on how to cite R or R packages in publications.

Type 'demo()' for some demos, 'help()' for on-line help, or
'help.start()' for an HTML browser interface to help.
Type 'q()' to quit R.

> library(GameTheory)
Loading required package: lpSolveAPI
Loading required package: combinat

Attaching package: 'combinat'

The following object is masked from 'package:utils':

    combn

Loading required package: gtools
Loading required package: ineq
Loading required package: kappalab
Loading required package: lpSolve
Loading required package: quadprog
Loading required package: kernlab

Attaching package: 'kappalab'

The following object is masked from 'package:ineq':

    entropy

> png(filename="/home/ddbj/snapshot/RGM3/R_CC/result/GameTheory/LorenzRules.Rd_%03d_medium.png", width=480, height=480)
> ### Name: LorenzRules
> ### Title: Inequality plot among rules
> ### Aliases: LorenzRules
>
> ### ** Examples
>
>
>
> ## replication of Gallastegui et al. (2003), Table 7.
>
> CLAIMS <- c(158,299,927,2196,4348,6256,13952)
> COUNTRIES <- c("Germany","Netherlands","Belgium","Ireland","UK","Spain","France")
> INARRA <- AllRules(13500,CLAIMS,COUNTRIES)
> summary(INARRA)

Claims of the Agents

    Germany Netherlands     Belgium     Ireland          UK       Spain
        158         299         927        2196        4348        6256
     France
      13952

Assignments according to the following rules

            Proportional     CEA      CEL Talmud      RA
Germany            75.81  158.00     0.00   79.0   73.73
Netherlands       143.46  299.00     0.00  149.5  139.53
Belgium           444.79  927.00     0.00  463.5  436.92
Ireland          1053.67 2196.00     0.00 1098.0 1071.42
UK               2086.22 3306.67   662.67 2174.0 2147.42
Spain            3001.71 3306.67  2570.67 3128.0 3101.42
France           6694.34 3306.67 10266.67 6408.0 6529.57

Inequality Analysis among rules (Gini Index)

Proportional          CEA          CEL       Talmud           RA
        0.58         0.38         0.77         0.56         0.57
>
> plot(INARRA,5) ## Display allocations for UK
> LorenzRules(INARRA) ## Inequality graph
>
>
>
>
>
> dev.off()
null device
          1
>
 .
.