Supported by Dr. Osamu Ogasawara and  . . |
|
Last data update: 2014.03.03 |
Gravity modelDescriptionImplements Murphy et al., (2010) gravity model Usagegravity(y, x, d, group, data, ln = TRUE, constrained = TRUE, ...) Arguments
Valueformula Model formula gravity Gravity model AIC AIC value for selected model x data.frame of independent variables y Vector of dependent variable groups Ordered factor vector of grouping variable fit Model Fitted Values NoteThe "group" factor defines the singly constrained direction (from or to) and the grouping structure for the origins. Depends: nlme, lattice Author(s)Jeffrey S. Evans <jeffrey_evans@tnc.org> and Melanie Murphy <melanie.murphy@uwyo.edu> ReferencesMurphy, M. A. & J.S. Evans. (in prep). "GenNetIt: gravity analysis in R for landscape genetics" Murphy M.A., R. Dezzani, D.S. Pilliod & A.S. Storfer (2010) Landscape genetics of high mountain frog metapopulations. Molecular Ecology 19(17):3634-3649 Examples
library(nlme)
data(ralu.model)
# Gravity
x = c("DISTANCE", "DEPTH_F", "HLI_F", "CTI_F", "cti", "ffp")
( gm <- gravity(y = "DPS", x = x, d = "DISTANCE", group = "FROM_SITE",
data = ralu.model, ln = FALSE) )
# Plot gravity results
par(mfrow=c(2,3))
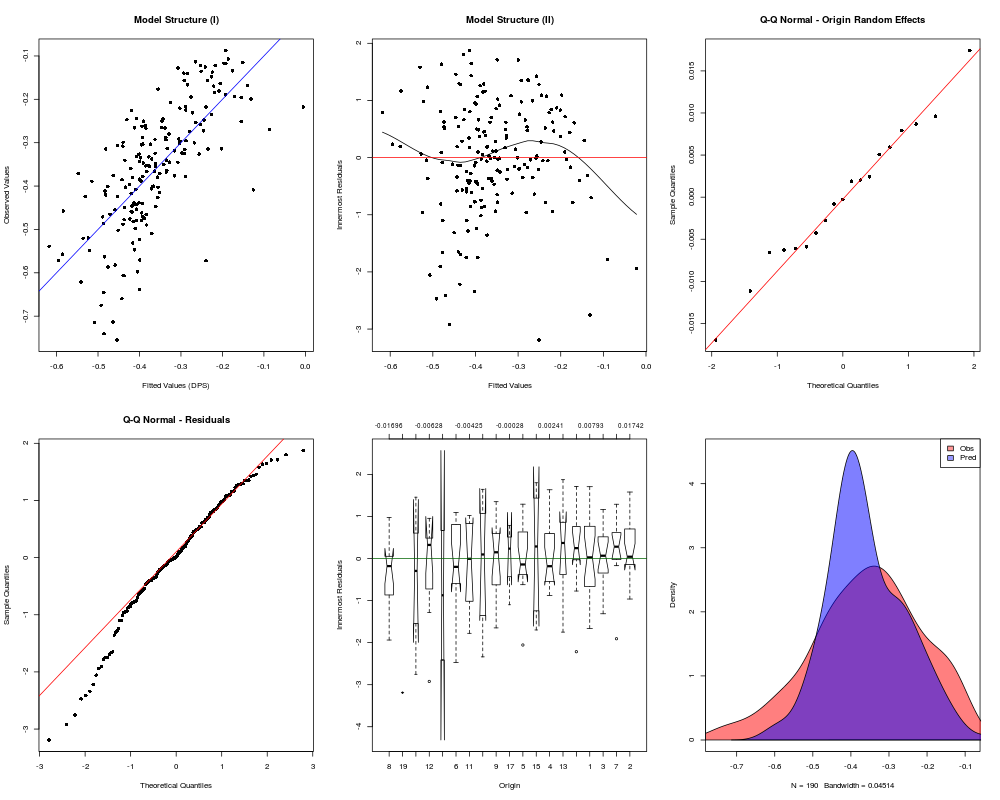
for (i in 1:6) { plot(gm, type=i) }
Results
R version 3.3.1 (2016-06-21) -- "Bug in Your Hair"
Copyright (C) 2016 The R Foundation for Statistical Computing
Platform: x86_64-pc-linux-gnu (64-bit)

R is free software and comes with ABSOLUTELY NO WARRANTY.
You are welcome to redistribute it under certain conditions.
Type 'license()' or 'licence()' for distribution details.

R is a collaborative project with many contributors.
Type 'contributors()' for more information and
'citation()' on how to cite R or R packages in publications.

Type 'demo()' for some demos, 'help()' for on-line help, or
'help.start()' for an HTML browser interface to help.
Type 'q()' to quit R.

> library(GeNetIt)
> png(filename="/home/ddbj/snapshot/RGM3/R_CC/result/GeNetIt/gravity.Rd_%03d_medium.png", width=480, height=480)
> ### Name: gravity
> ### Title: Gravity model
> ### Aliases: gravity
>
> ### ** Examples
>
> library(nlme)
> data(ralu.model)
>
> # Gravity
> x = c("DISTANCE", "DEPTH_F", "HLI_F", "CTI_F", "cti", "ffp")
> ( gm <- gravity(y = "DPS", x = x, d = "DISTANCE", group = "FROM_SITE",
+                 data = ralu.model, ln = FALSE) )
[1] "Running singly-constrained gravity model"
Gravity model

Linear mixed-effects model fit by REML
 Data: gdata
        AIC       BIC   logLik
  -280.1398 -251.2545 149.0699

Random effects:
 Formula: ~1 | FROM_SITE
        (Intercept)  Residual
StdDev:  0.01875411 0.1007295

Fixed effects: list(fmla)
                Value Std.Error  DF   t-value p-value
(Intercept) -5.926103 1.4920658 168 -3.971744  0.0001
DISTANCE    -0.109680 0.0118781 168 -9.233851  0.0000
DEPTH_F      0.025633 0.0094633  15  2.708728  0.0162
HLI_F        0.156871 0.1316072  15  1.191962  0.2518
CTI_F       -0.048095 0.0401198  15 -1.198791  0.2492
cti         -0.197073 0.0869938 168 -2.265362  0.0248
ffp          0.910712 0.1430268 168  6.367426  0.0000
 Correlation:
         (Intr) DISTAN DEPTH_ HLI_F  CTI_F  cti
DISTANCE -0.270
DEPTH_F  -0.579  0.066
HLI_F    -0.812  0.125  0.833
CTI_F     0.329 -0.072 -0.674 -0.583
cti      -0.050  0.461  0.028  0.035 -0.115
ffp      -0.797  0.145  0.124  0.321  0.009 -0.159

Standardized Within-Group Residuals:
        Min          Q1         Med          Q3         Max
-3.19045601 -0.46459488  0.01573003  0.66508837  1.87341262

Number of Observations: 190
Number of Groups: 19
>
> # Plot gravity results
>  par(mfrow=c(2,3))
>    for (i in 1:6) { plot(gm, type=i) }
>
>
>
>
>
>
> dev.off()
null device
          1
>
|