Supported by Dr. Osamu Ogasawara and  . . |
|
Last data update: 2014.03.03 |
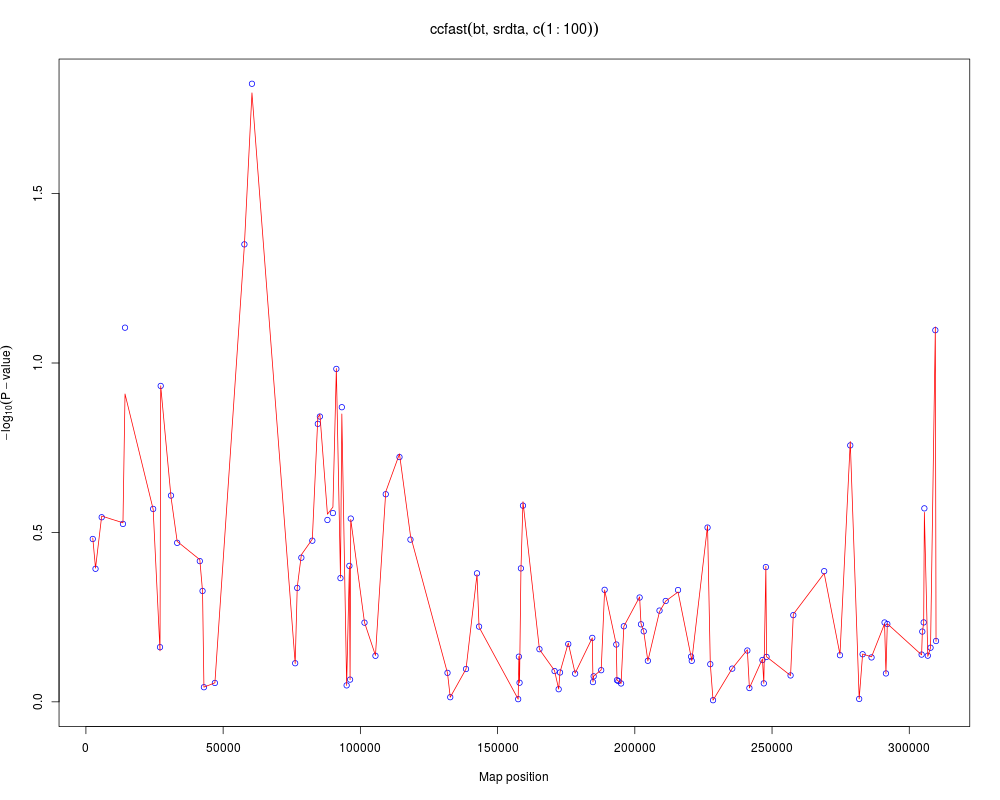
function to plot additional GWAA resultsDescriptionAdd plot of results of GWA analysis Usage
add.plot(x, ..., df = 1, col=c("lightgreen","lightblue"), sort=TRUE, delta = 1)
Arguments
ValueNo value returned. Author(s)Yurii Aulchenko See Also
Examples
require(GenABEL.data)
data(srdta)
a <- ccfast("bt",srdta,snps=c(1:100))
plot(a)
a1 <- qtscore(bt,srdta,snps=c(1:100))
add.plot(a1,col="red",type="l")
Results
R version 3.3.1 (2016-06-21) -- "Bug in Your Hair"
Copyright (C) 2016 The R Foundation for Statistical Computing
Platform: x86_64-pc-linux-gnu (64-bit)

R is free software and comes with ABSOLUTELY NO WARRANTY.
You are welcome to redistribute it under certain conditions.
Type 'license()' or 'licence()' for distribution details.

R is a collaborative project with many contributors.
Type 'contributors()' for more information and
'citation()' on how to cite R or R packages in publications.

Type 'demo()' for some demos, 'help()' for on-line help, or
'help.start()' for an HTML browser interface to help.
Type 'q()' to quit R.

> library(GenABEL)
Loading required package: MASS
Loading required package: GenABEL.data
> png(filename="/home/ddbj/snapshot/RGM3/R_CC/result/GenABEL/add.plot.Rd_%03d_medium.png", width=480, height=480)
> ### Name: add.plot
> ### Title: function to plot additional GWAA results
> ### Aliases: add.plot
> ### Keywords: aplot
>
> ### ** Examples
>
> require(GenABEL.data)
> data(srdta)
> a <- ccfast("bt",srdta,snps=c(1:100))
Warning in ccfast("bt", srdta, snps = c(1:100)) :
  11 people (out of 2500 ) excluded as not having cc status

> plot(a)
> a1 <- qtscore(bt,srdta,snps=c(1:100))
Warning messages:
1: In test.type(y, trait.type) : binomial trait is analysed as gaussian
2: In qtscore(bt, srdta, snps = c(1:100)) :
  11 observations deleted due to missingness
3: In qtscore(bt, srdta, snps = c(1:100)) : Lambda estimated < 1, set to 1
> add.plot(a1,col="red",type="l")
>
>
>
>
>
> dev.off()
null device
          1
>
|
Created & Maintained by Osamu Ogasawara (osamu.ogasawara@gmail.com) and 