Supported by Dr. Osamu Ogasawara and  . . |
|
Last data update: 2014.03.03 |
function to do primitive trait quality controlDescriptionThis function check for outliers (using FDR framework) and plots the raw data. Usagecheck.trait(trait, data, fdrate = 0.05, graph = TRUE, binshow = FALSE, qoption = "bh95") Arguments
DetailsThe P-value that a particulat measurment is an outlier is compted as folowing. Consider trait vector Y with particulat i^{th} measurment denodet as y_i. Let Y(-i) is vector, which is the same as Y, except that i^{th} measurment is dropped. Then Chi-square for measurment i is computed as Chi_{i} = (mean(Y(-i)) - y_i)^2/var(Y(-i)) P-value is computed using 1 d.f., and the vector of P-values enters FDR computation procedure (BH95 by default). ValueNo value returned, output is made to the screen and graphical device. Author(s)Yurii Aulchenko See Also
Examples
require(GenABEL.data)
data(srdta)
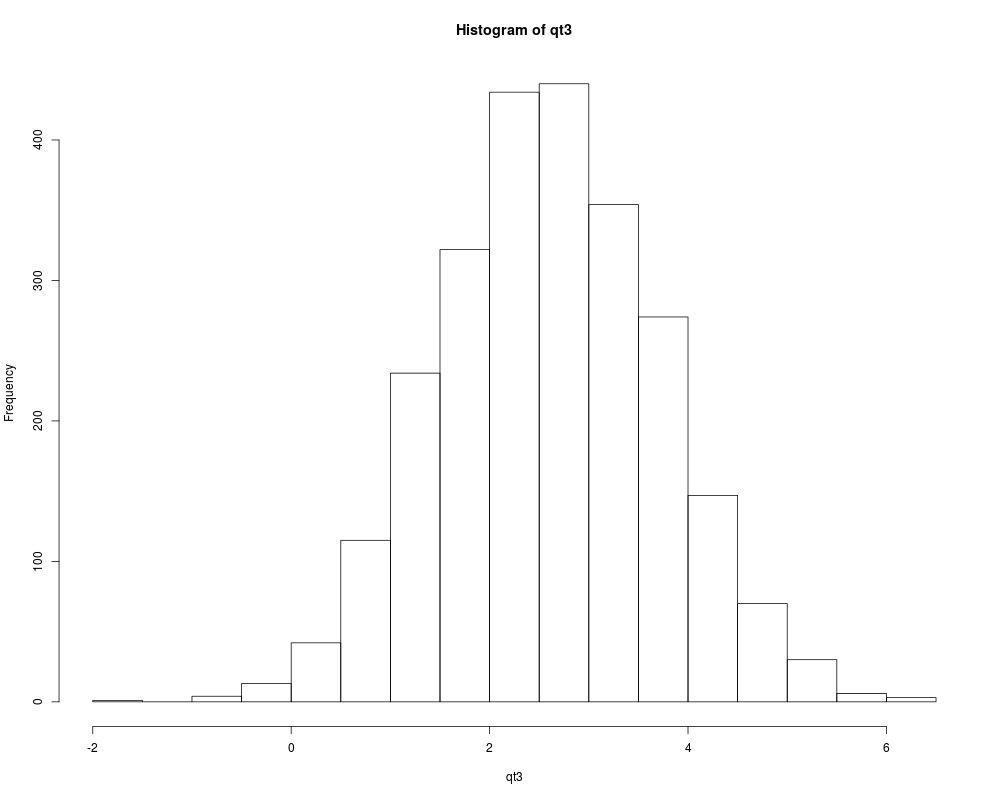
check.trait("qt3",data=srdta)
n <- names(srdta@phdata)
check.trait(n,data=srdta)
Results
R version 3.3.1 (2016-06-21) -- "Bug in Your Hair"
Copyright (C) 2016 The R Foundation for Statistical Computing
Platform: x86_64-pc-linux-gnu (64-bit)

R is free software and comes with ABSOLUTELY NO WARRANTY.
You are welcome to redistribute it under certain conditions.
Type 'license()' or 'licence()' for distribution details.

R is a collaborative project with many contributors.
Type 'contributors()' for more information and
'citation()' on how to cite R or R packages in publications.

Type 'demo()' for some demos, 'help()' for on-line help, or
'help.start()' for an HTML browser interface to help.
Type 'q()' to quit R.

> library(GenABEL)
Loading required package: MASS
Loading required package: GenABEL.data
> png(filename="/home/ddbj/snapshot/RGM3/R_CC/result/GenABEL/check.trait.Rd_%03d_medium.png", width=480, height=480)
> ### Name: check.trait
> ### Title: function to do primitive trait quality control
> ### Aliases: check.trait
> ### Keywords: misc
>
> ### ** Examples
>
> require(GenABEL.data)
> data(srdta)
> check.trait("qt3",data=srdta)
--------------------------------
Trait qt3 has 2489 measurements
Missing: 11 ( 0.44 %)
Mean = 2.60859 ; s.d. = 1.101154
NO outliers discovered for trait qt3
> n <- names(srdta@phdata)
> check.trait(n,data=srdta)
--------------------------------
trait id is not numeric, skipping
--------------------------------
Trait sex has 2500 measurements
Missing: 0 ( 0 %)
Mean = 0.51 ; s.d. = 0.5
NO outliers discovered for trait sex
--------------------------------
Trait age has 2500 measurements
Missing: 0 ( 0 %)
Mean = 50.0378 ; s.d. = 7.060125
NO outliers discovered for trait age
--------------------------------
Trait qt1 has 2497 measurements
Missing: 3 ( 0.12 %)
Mean = -0.2981097 ; s.d. = 1.000527
Outliers discovered for trait qt1 :
p691
-4.6
--------------------------------
Trait qt2 has 2500 measurements
Missing: 0 ( 0 %)
Mean = 6.122224 ; s.d. = 30.60056
Outliers discovered for trait qt2 :
p4 p14 p26
888 888 888
--------------------------------
Trait qt3 has 2489 measurements
Missing: 11 ( 0.44 %)
Mean = 2.60859 ; s.d. = 1.101154
NO outliers discovered for trait qt3
--------------------------------
Trait bt has 2489 measurements
Missing: 11 ( 0.44 %)
Mean = 0.4997991 ; s.d. = 0.5001004
NO outliers discovered for trait bt
>
>
>
>
>
> dev.off()
null device
          1
>
|