Supported by Dr. Osamu Ogasawara and  . . |
|
Last data update: 2014.03.03 |
Fast score test for association, corrected with PCDescriptionFast score test for association between a trait and genetic polymorphism, adjusted for possible stratification by principal components. Usage
  egscore(formula, data, snpsubset, idsubset,
    kinship.matrix, naxes = 3, strata, times = 1,
    quiet = FALSE, bcast = 10, clambda = TRUE, propPs = 1)
Arguments
DetailsThe idea of this test is to use genomic kinship matrix to
first, derive axes of genetic variation (principal
components), and, second, adjust both trait and genotypes
onto these axes. Note that the diagonal of the kinship
matrix should be replaced (default it is 0.5*(1+F), and
for EIGENSTRAT one needs variance). These variances are
porduced by The traits is first analysed using LM and with covariates as specified with formula and also with axes of variation as predictors. Corrected genotypes are defined as residuals from regression of genotypes onto axes (which are orthogonal). Correlaton between corrected genotypes and phenotype is computed, and test statistics is defined as square of this correlation times (N - K - 1), where N is number of genotyped subjects and K is the number of axes. This test is defined only for 1 d.f. ValueObject of class Author(s)Yurii Aulchenko ReferencesPrice A. L. et al, Principal components analysis corrects for stratification in genome-wide association studies. Nat Genet 38: 904-909. See Also
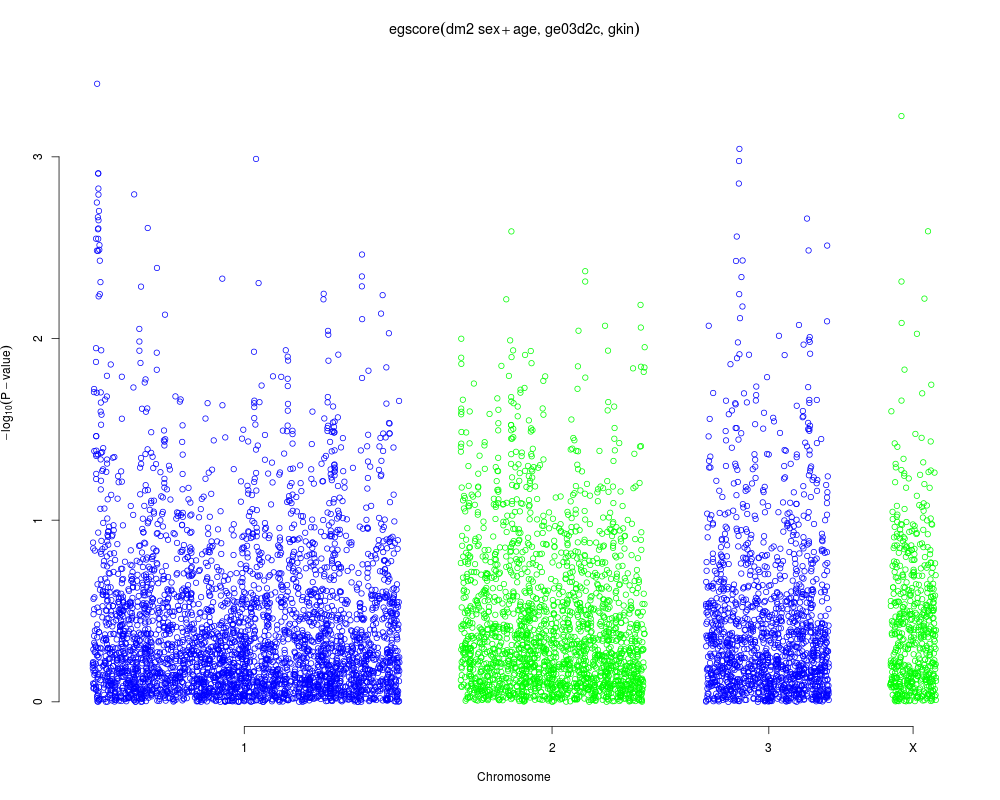
Examplesrequire(GenABEL.data) data(ge03d2c) #egscore with stratification gkin <- ibs(ge03d2c[,autosomal(ge03d2c)],w="freq") #replace the diagonal with right elements diag(gkin) <- hom(ge03d2c[,autosomal(ge03d2c)])$Var a <- egscore(dm2~sex+age,data=ge03d2c,kin=gkin) plot(a,df="Pc1df") Results
R version 3.3.1 (2016-06-21) -- "Bug in Your Hair"
Copyright (C) 2016 The R Foundation for Statistical Computing
Platform: x86_64-pc-linux-gnu (64-bit)

R is free software and comes with ABSOLUTELY NO WARRANTY.
You are welcome to redistribute it under certain conditions.
Type 'license()' or 'licence()' for distribution details.

R is a collaborative project with many contributors.
Type 'contributors()' for more information and
'citation()' on how to cite R or R packages in publications.

Type 'demo()' for some demos, 'help()' for on-line help, or
'help.start()' for an HTML browser interface to help.
Type 'q()' to quit R.

> library(GenABEL)
Loading required package: MASS
Loading required package: GenABEL.data
> png(filename="/home/ddbj/snapshot/RGM3/R_CC/result/GenABEL/egscore.Rd_%03d_medium.png", width=480, height=480)
> ### Name: egscore
> ### Title: Fast score test for association, corrected with PC
> ### Aliases: egscore
> ### Keywords: htest
>
> ### ** Examples
>
> require(GenABEL.data)
> data(ge03d2c)
> #egscore with stratification
> gkin <- ibs(ge03d2c[,autosomal(ge03d2c)],w="freq")
> #replace the diagonal with right elements
> diag(gkin) <- hom(ge03d2c[,autosomal(ge03d2c)])$Var
> a <- egscore(dm2~sex+age,data=ge03d2c,kin=gkin)
> plot(a,df="Pc1df")
>
>
>
>
>
> dev.off()
null device
          1
>
|