Supported by Dr. Osamu Ogasawara and  . . |
|
Last data update: 2014.03.03 |
Genome-wide significance for a GWA scanDescriptionGenome-wide significance for a GWA scan. Analysis
function is Usageemp.qtscore(formula , data, snpsubset, idsubset, strata, trait.type="gaussian", times = 200, quiet=FALSE, bcast = 10) ArgumentsAll arguments are the same as in and passed intact to the
DetailsIn the analysis of empirical significance, first time the function
The list elements effB, effAB and effBB are the ones obtained from the analysis of the original (not permuted) data set The function does not yet implement correct analysis for X-linked data. ValueObject of class Author(s)Yurii Aulchenko See Also
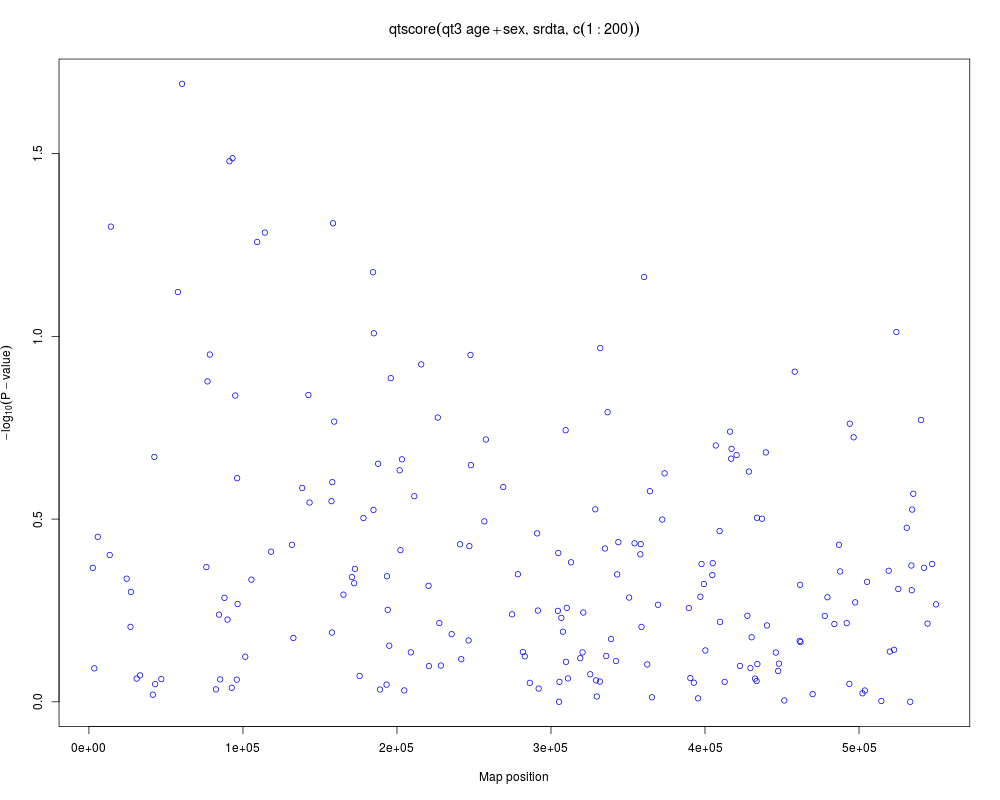
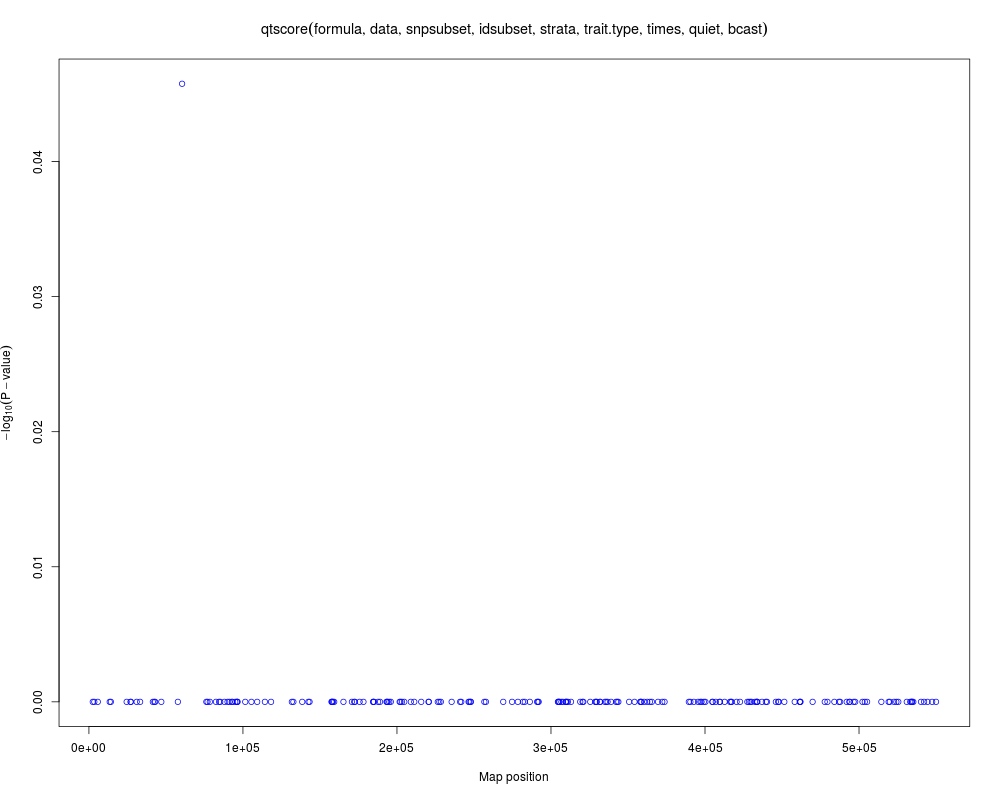
Examplesrequire(GenABEL.data) data(srdta) a<-qtscore(qt3~age+sex,data=srdta,snps=c(1:200)) plot(a) # this does not make sense, as the whole experiment must be analysed, not a small region! # also, times = 20 is way too small (should be at least 200) b<-emp.qtscore(qt3~age+sex,data=srdta,snps=c(1:200), times = 20) plot(b) Results
R version 3.3.1 (2016-06-21) -- "Bug in Your Hair"
Copyright (C) 2016 The R Foundation for Statistical Computing
Platform: x86_64-pc-linux-gnu (64-bit)

R is free software and comes with ABSOLUTELY NO WARRANTY.
You are welcome to redistribute it under certain conditions.
Type 'license()' or 'licence()' for distribution details.

R is a collaborative project with many contributors.
Type 'contributors()' for more information and
'citation()' on how to cite R or R packages in publications.

Type 'demo()' for some demos, 'help()' for on-line help, or
'help.start()' for an HTML browser interface to help.
Type 'q()' to quit R.

> library(GenABEL)
Loading required package: MASS
Loading required package: GenABEL.data
> png(filename="/home/ddbj/snapshot/RGM3/R_CC/result/GenABEL/emp.qtscore.Rd_%03d_medium.png", width=480, height=480)
> ### Name: emp.qtscore
> ### Title: Genome-wide significance for a GWA scan
> ### Aliases: emp.qtscore
> ### Keywords: htest
>
> ### ** Examples
>
> require(GenABEL.data)
> data(srdta)
> a<-qtscore(qt3~age+sex,data=srdta,snps=c(1:200))
Warning messages:
1: In qtscore(qt3 ~ age + sex, data = srdta, snps = c(1:200)) :
  11 observations deleted due to missingness
2: In qtscore(qt3 ~ age + sex, data = srdta, snps = c(1:200)) :
  Lambda estimated < 1, set to 1
> plot(a)
> # this does not make sense, as the whole experiment must be analysed, not a small region!
> # also, times = 20 is way too small (should be at least 200)
> b<-emp.qtscore(qt3~age+sex,data=srdta,snps=c(1:200), times = 20)
   |                                                                               |                                                                      |   0%   |                                                                               |===================================                                   |  50%   |                                                                               |======================================================================| 100%
Warning messages:
1: In qtscore(formula = formula, data = data, snpsubset = snpsubset,  :
  11 observations deleted due to missingness
2: In qtscore(formula = formula, data = data, snpsubset = snpsubset,  :
  Lambda estimated < 1, set to 1
> plot(b)
>
>
>
>
>
> dev.off()
null device
          1
>
|