R: Estimate the inflation factor for a distribution of P-values
estlambda
R Documentation
Estimate the inflation factor for a distribution of P-values
Description
Estimate the inflation factor for a distribution of
P-values or 1df chi-square test. The major use of this
procedure is the Genomic Control, but can also be used to
visualise the distribution of P-values coming from other
tests. Methods implemented include 'median'
(median(chi2)/0.455...), regression (of observed onto
expected) and 'KS' (optimizing the chi2.1df distribution
fit by use of Kolmogorov-Smirnov test)
R version 3.3.1 (2016-06-21) -- "Bug in Your Hair"
Copyright (C) 2016 The R Foundation for Statistical Computing
Platform: x86_64-pc-linux-gnu (64-bit)
R is free software and comes with ABSOLUTELY NO WARRANTY.
You are welcome to redistribute it under certain conditions.
Type 'license()' or 'licence()' for distribution details.
R is a collaborative project with many contributors.
Type 'contributors()' for more information and
'citation()' on how to cite R or R packages in publications.
Type 'demo()' for some demos, 'help()' for on-line help, or
'help.start()' for an HTML browser interface to help.
Type 'q()' to quit R.
> library(GenABEL)
Loading required package: MASS
Loading required package: GenABEL.data
> png(filename="/home/ddbj/snapshot/RGM3/R_CC/result/GenABEL/estlambda.Rd_%03d_medium.png", width=480, height=480)
> ### Name: estlambda
> ### Title: Estimate the inflation factor for a distribution of P-values
> ### Aliases: estlambda
> ### Keywords: htest
>
> ### ** Examples
>
> require(GenABEL.data)
> data(srdta)
> pex <- summary(gtdata(srdta))[,"Pexact"]
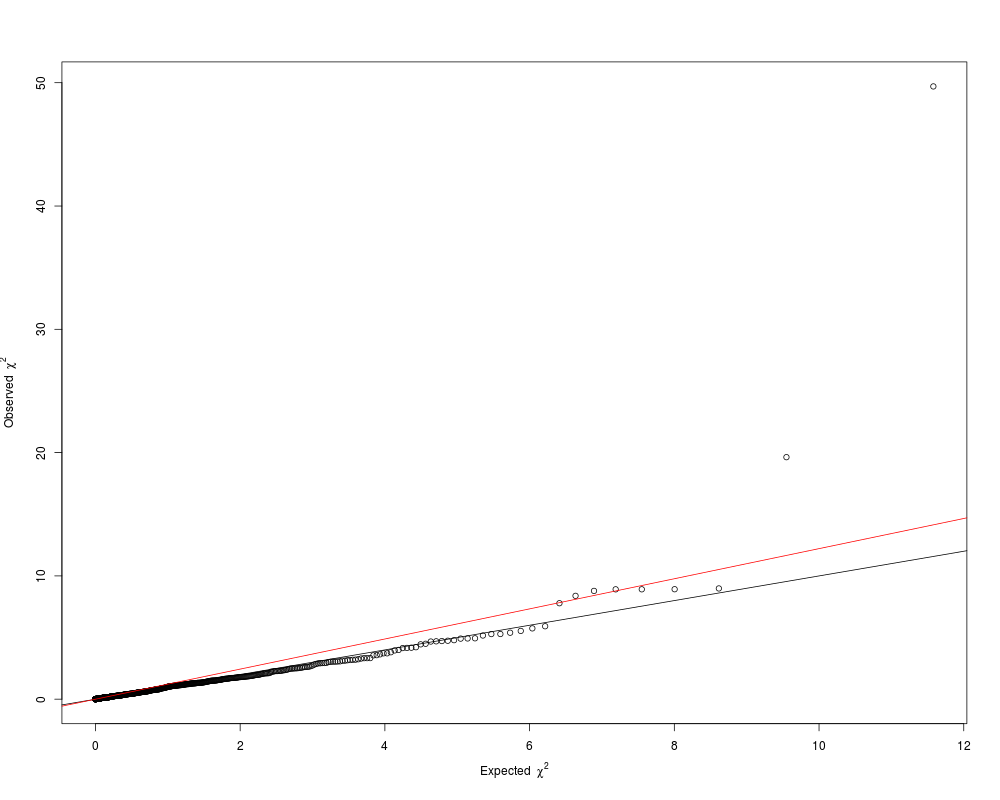
> estlambda(pex, plot=TRUE)
$estimate
[1] 1.221399
$se
[1] 0.02964587
> estlambda(pex, method="regression", proportion = 0.95)
$estimate
[1] 1.221399
$se
[1] 0.02964587
> estlambda(pex, method="median")
$estimate
[1] 0.9069703
$se
[1] NA
> estlambda(pex, method="KS")
$estimate
[1] 0.5000458
$se
[1] NA
Warning message:
In estlambda(pex, method = "KS") :
using method='KS' lambda too close to limits, use other method
> a <- qtscore(bt,srdta)
Warning messages:
1: In test.type(y, trait.type) : binomial trait is analysed as gaussian
2: In qtscore(bt, srdta) : 11 observations deleted due to missingness
3: In qtscore(bt, srdta) : Lambda estimated < 1, set to 1
> lambda(a)
$estimate
[1] 1
$se
[1] NA
>
>
>
>
>
> dev.off()
null device
1
>
 .
.