Supported by Dr. Osamu Ogasawara and  . . |
|
Last data update: 2014.03.03 |
Summary of marker data per personDescriptionProduces call rate and heterozygosity per person Usageperid.summary(data, snpsubset, idsubset, ... ) Arguments
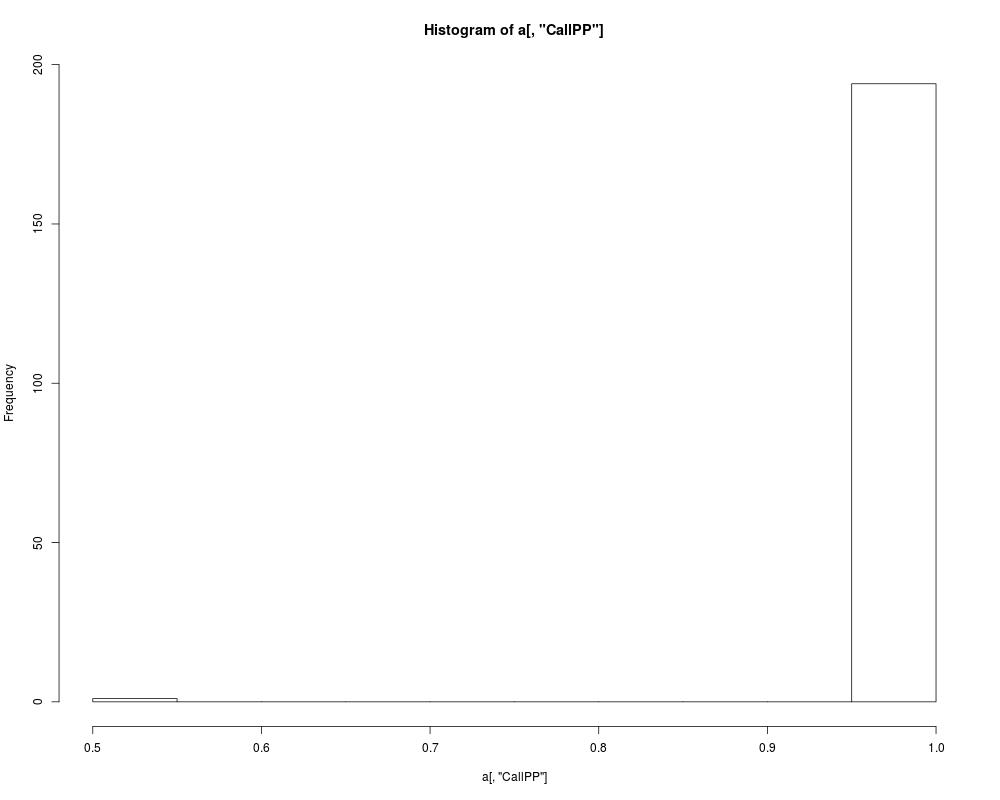
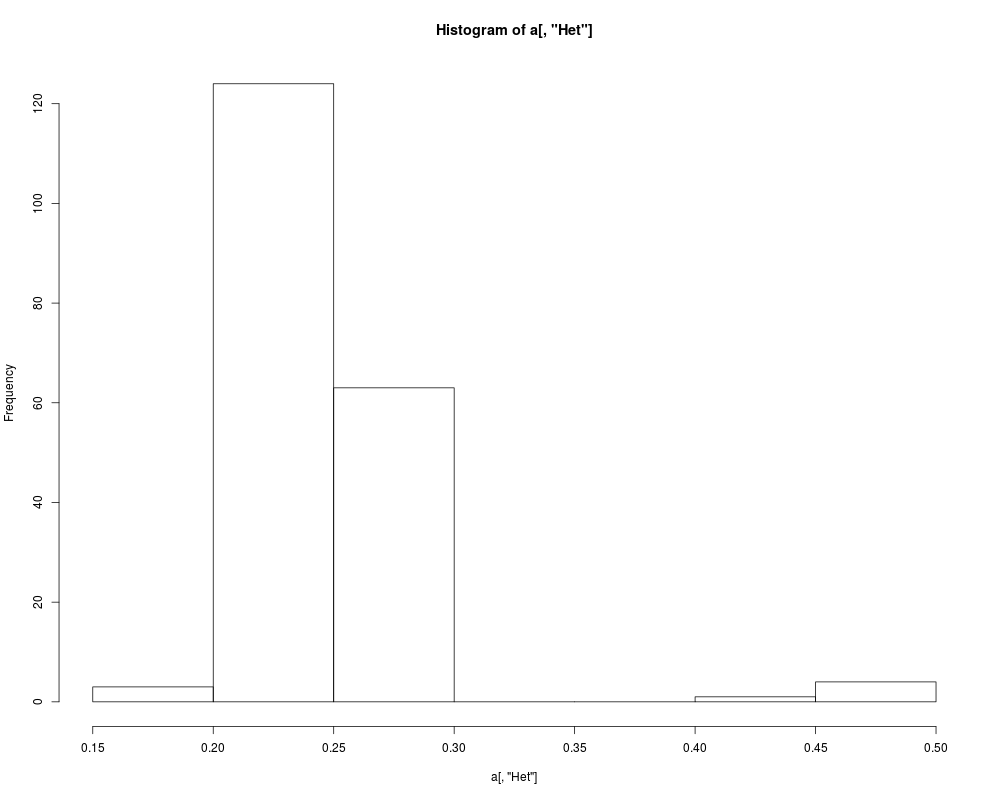
DetailsThis function facilitates quality control of genomic data. E.g. extreme outliers for heterozygosity indicate possibly contaminated DNA samples, while low call rate of a person may indicate poor DNA quality. ValueA matrix, giving per person (row) its' average heterozygosity ("Het" column) and call rate ("CallPP"), over all SNPs Author(s)Yurii Aulchenko See Also
Examplesrequire(GenABEL.data) data(ge03d2c) a <- perid.summary(data=ge03d2c,snps=c(1:100),ids=c(1:10)) a a <- perid.summary(data=ge03d2c) hist(a[,"CallPP"]) hist(a[,"Het"]) Results
R version 3.3.1 (2016-06-21) -- "Bug in Your Hair"
Copyright (C) 2016 The R Foundation for Statistical Computing
Platform: x86_64-pc-linux-gnu (64-bit)

R is free software and comes with ABSOLUTELY NO WARRANTY.
You are welcome to redistribute it under certain conditions.
Type 'license()' or 'licence()' for distribution details.

R is a collaborative project with many contributors.
Type 'contributors()' for more information and
'citation()' on how to cite R or R packages in publications.

Type 'demo()' for some demos, 'help()' for on-line help, or
'help.start()' for an HTML browser interface to help.
Type 'q()' to quit R.

> library(GenABEL)
Loading required package: MASS
Loading required package: GenABEL.data
> png(filename="/home/ddbj/snapshot/RGM3/R_CC/result/GenABEL/perid.summary.Rd_%03d_medium.png", width=480, height=480)
> ### Name: perid.summary
> ### Title: Summary of marker data per person
> ### Aliases: perid.summary
> ### Keywords: htest
>
> ### ** Examples
>
> require(GenABEL.data)
> data(ge03d2c)
> a <- perid.summary(data=ge03d2c,snps=c(1:100),ids=c(1:10))
> a
      NoMeasured NoPoly       Hom    E(Hom)       Var           F CallPP
id199         99     83 0.7878788 0.7651154 0.2673301  0.09691292   0.99
id287        100     84 0.4700000 0.7652421 1.2023533 -1.25764465   1.00
id300         98     83 0.9183673 0.7627187 0.2584275  0.65596683   0.98
id403         99     84 0.8080808 0.7628708 0.4410083  0.19065569   0.99
id415         99     83 0.5858586 0.7674303 0.6160298 -0.78071922   0.99
id666         98     82 0.7448980 0.7683876 0.3172106 -0.10141786   0.98
id689         99     83 0.7676768 0.7640633 0.3338151  0.01531561   0.99
id765         98     82 0.8265306 0.7666667 0.3475676  0.25655977   0.98
id830         98     82 0.8163265 0.7648445 0.3213084  0.21892758   0.98
id908         99     83 0.8888889 0.7678311 0.2795422  0.52142123   0.99
             Het
id199 0.21212121
id287 0.53000000
id300 0.08163265
id403 0.19191919
id415 0.41414141
id666 0.25510204
id689 0.23232323
id765 0.17346939
id830 0.18367347
id908 0.11111111
> a <- perid.summary(data=ge03d2c)
> hist(a[,"CallPP"])
> hist(a[,"Het"])
>
>
>
>
>
> dev.off()
null device
          1
>
|