Supported by Dr. Osamu Ogasawara and  . . |
|
Last data update: 2014.03.03 |
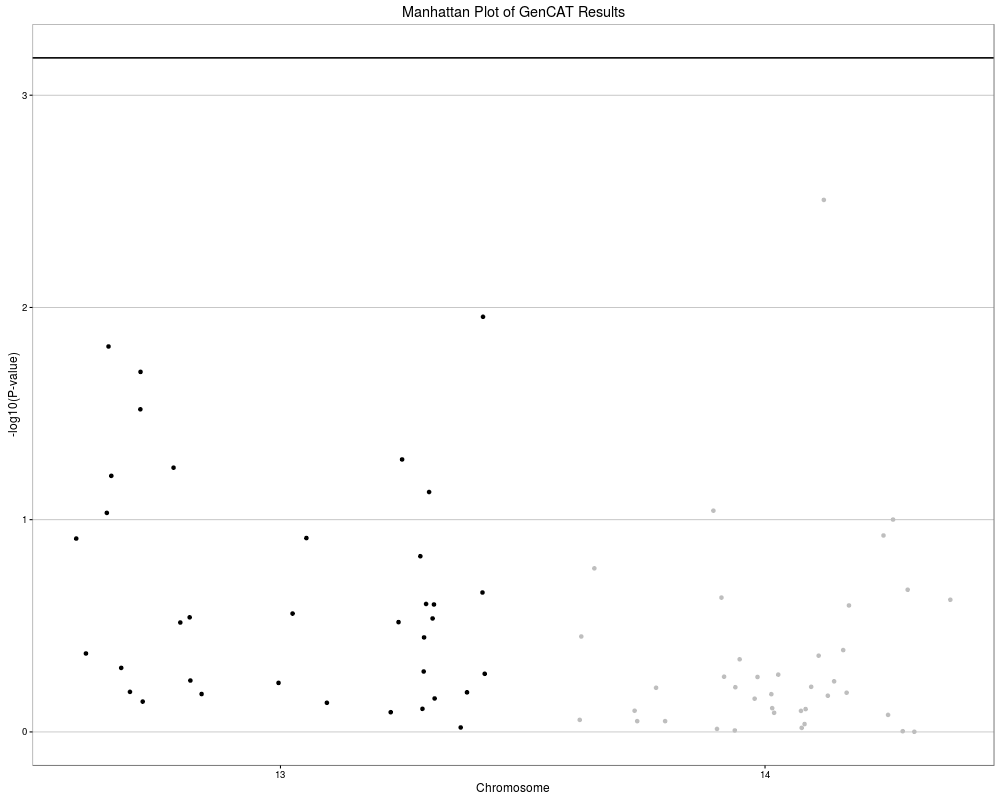
Create Manhattan Plot of GenCAT ResultsDescriptionThis function will create a Manhattan Plot from output of UsageGenCAT_manhattan(GenCATout, sigThresh = NULL, highlightPosi = FALSE, labelPosi = FALSE, sepChr = 8e+05, plotTitle = "Manhattan Plot of GenCAT Results") Arguments
Details
Author(s)Eric Reed, Sara Nunez, Jing Qian, Andrea Foulkes Examples
###############
#Running GenCAT
###############
data("CardioMapped")

#Subset CardioMapped to decrease CPU time
CardioMappedSub<-CardioMapped[CardioMapped$chr < 15,]
set.seed(1)
CardioMappedSub<-CardioMappedSub[sample(1:nrow(CardioMappedSub), 100),]

library(snpStats)
data('geno')

genoData<-geno$genotypes
snpInfo<-geno$map

colnames(snpInfo)<-c('chr', 'SNP', 'gen.dist', 'position', 'A1', 'A2')
print(head(snpInfo))

GenCATtest <- GenCAT(CardioMappedSub, genoData=genoData, snpInfo = snpInfo)

######################
#Create Manhattan Plot
######################

print(str(GenCATtest))
GenCAT_manhattan(GenCATtest, sigThresh = (0.05/nrow(GenCATtest$GenCAT)),
highlightPosi = TRUE, labelPosi = TRUE)
Results
R version 3.3.1 (2016-06-21) -- "Bug in Your Hair"
Copyright (C) 2016 The R Foundation for Statistical Computing
Platform: x86_64-pc-linux-gnu (64-bit)

R is free software and comes with ABSOLUTELY NO WARRANTY.
You are welcome to redistribute it under certain conditions.
Type 'license()' or 'licence()' for distribution details.

R is a collaborative project with many contributors.
Type 'contributors()' for more information and
'citation()' on how to cite R or R packages in publications.

Type 'demo()' for some demos, 'help()' for on-line help, or
'help.start()' for an HTML browser interface to help.
Type 'q()' to quit R.

> library(GenCAT)
Loading required package: dplyr

Attaching package: 'dplyr'

The following objects are masked from 'package:stats':

    filter, lag

The following objects are masked from 'package:base':

    intersect, setdiff, setequal, union

Loading required package: doParallel
Loading required package: foreach
Loading required package: iterators
Loading required package: parallel
Loading required package: ggplot2
> png(filename="/home/ddbj/snapshot/RGM3/R_CC/result/GenCAT/GenCAT_manhattan.Rd_%03d_medium.png", width=480, height=480)
> ### Name: GenCAT_manhattan
> ### Title: Create Manhattan Plot of GenCAT Results
> ### Aliases: GenCAT_manhattan
>
> ### ** Examples
>
> ###############
> #Running GenCAT
> ###############
> data("CardioMapped")
>
> #Subset CardioMapped to decrease CPU time
> CardioMappedSub<-CardioMapped[CardioMapped$chr < 15,]
> set.seed(1)
> CardioMappedSub<-CardioMappedSub[sample(1:nrow(CardioMappedSub), 100),]
>
> library(snpStats)
Loading required package: survival
Loading required package: Matrix
> data('geno')
>
> genoData<-geno$genotypes
> snpInfo<-geno$map
>
> colnames(snpInfo)<-c('chr', 'SNP', 'gen.dist', 'position', 'A1', 'A2')
> print(head(snpInfo))
          chr       SNP gen.dist position A1 A2
rs624673   13  rs624673       NA 19743996  G  A
rs9511877  13 rs9511877       NA 19744070  A  G
rs638773   13  rs638773       NA 19744848  A  G
rs9511880  13 rs9511880       NA 19745096  G  T
rs482278   13  rs482278       NA 19745251  A  G
rs9507552  13 rs9507552       NA 19745903  G  A
>
> GenCATtest <- GenCAT(CardioMappedSub, genoData=genoData, snpInfo = snpInfo)
[1] "Running GenCAT on 41 classes on chromosome 13."
[1] "Running GenCAT on 43 classes on chromosome 14."
>
> ######################
> #Create Manhattan Plot
> ######################
>
> print(str(GenCATtest))
List of 5
 $ GenCAT    :'data.frame':	75 obs. of  6 variables:
  ..$ class : chr [1:75] "STK24" "LRCH1" "FLT1" "HTR2A" ...
  ..$ chr   : num [1:75] 13 13 13 13 13 13 13 13 13 13 ...
  ..$ n_SNPs: num [1:75] 1 1 1 1 1 1 1 1 1 1 ...
  ..$ n_Obs : num [1:75] 1 1 1 1 1 1 1 1 1 1 ...
  ..$ CsumT : num [1:75] 2.086 1.127 5.885 0.318 3.626 ...
  ..$ CsumP : num [1:75] 0.1486 0.2884 0.0153 0.5727 0.0569 ...
 $ Used      :'data.frame':	88 obs. of  9 variables:
  ..$ SNP          : chr [1:88] "rs4389009" "rs844520" "rs11149523" "rs9567737" ...
  ..$ effect_allele: chr [1:88] "G" "G" "G" "C" ...
  ..$ other_allele : chr [1:88] "A" "A" "A" "T" ...
  ..$ testStat     : num [1:88] -1.444 1.062 2.426 -0.564 -1.904 ...
  ..$ class        : chr [1:88] "STK24" "LRCH1" "FLT1" "HTR2A" ...
  ..$ chr          : num [1:88] 13 13 13 13 13 13 13 13 13 13 ...
  ..$ position     : num [1:88] 99193519 47264930 28995630 47421266 43639845 ...
  ..$ A1           : chr [1:88] "A" "G" "A" "C" ...
  ..$ A2           : chr [1:88] "G" "A" "G" "T" ...
 $ notFound  :'data.frame':	12 obs. of  5 variables:
  ..$ SNP          : chr [1:12] "rs9572807" "rs7987481" "rs17253843" "rs7335275" ...
  ..$ effect_allele: chr [1:12] "C" "G" "G" "C" ...
  ..$ other_allele : chr [1:12] "T" "A" "A" "T" ...
  ..$ testStat     : num [1:12] -0.3015 -1.0024 0.0867 0.7788 -0.1335 ...
  ..$ class        : chr [1:12] "DACH1" "LRCH1" "GPC6" "ABCC4" ...
 $ unMatched :'data.frame':	0 obs. of  9 variables:
  ..$ SNP          : logi(0)
  ..$ effect_allele: logi(0)
  ..$ other_allele : logi(0)
  ..$ testStat     : num(0)
  ..$ class        : logi(0)
  ..$ chr          : num(0)
  ..$ position     : num(0)
  ..$ A1           : logi(0)
  ..$ A2           : logi(0)
 $ TransStats:'data.frame':	88 obs. of  2 variables:
  ..$ class    : chr [1:88] "STK24" "LRCH1" "FLT1" "HTR2A" ...
  ..$ transStat: num [1:88] 1.444 1.062 -2.426 -0.564 1.904 ...
 - attr(*, "class")= chr "GenCATtest"
NULL
> GenCAT_manhattan(GenCATtest, sigThresh = (0.05/nrow(GenCATtest$GenCAT)),
+ highlightPosi = TRUE, labelPosi = TRUE)
>
>
>
>
>
> dev.off()
null device
          1
>
|
Created & Maintained by Osamu Ogasawara (osamu.ogasawara@gmail.com) and 