Supported by Dr. Osamu Ogasawara and  . . |
|
Last data update: 2014.03.03 |
Locate value for ith percentage point in a binned distributionDescriptionCalculates the value for the ith point in a binned distribution Usageper(den, vals, point, na.rm=FALSE, neg.rm=FALSE) Arguments
Valuereturns a value:
AcknowledgementsWritten in collaboration with A.M.Pollard <mark.pollard@rlaha.ox.ac.uk> with the financial support of the Natural Environment Research Council (NERC) grant GR3/11395 NoteNot restricted to uniform bin widths but due to linear interpolation gets less accurate as bin widths deviate from uniformity. The vectors must be in ascending order of bin centres bin break points. The density can be a frequency in that it doesn't have to sum to unity. Out of character for the rest of the GenKern package this function does assume proper bins rather than ordinates, although if a density estimate has been generated using Author(s)David Lucy <d.lucy@lancaster.ac.uk> http://www.maths.lancs.ac.uk/~lucy/
See Also
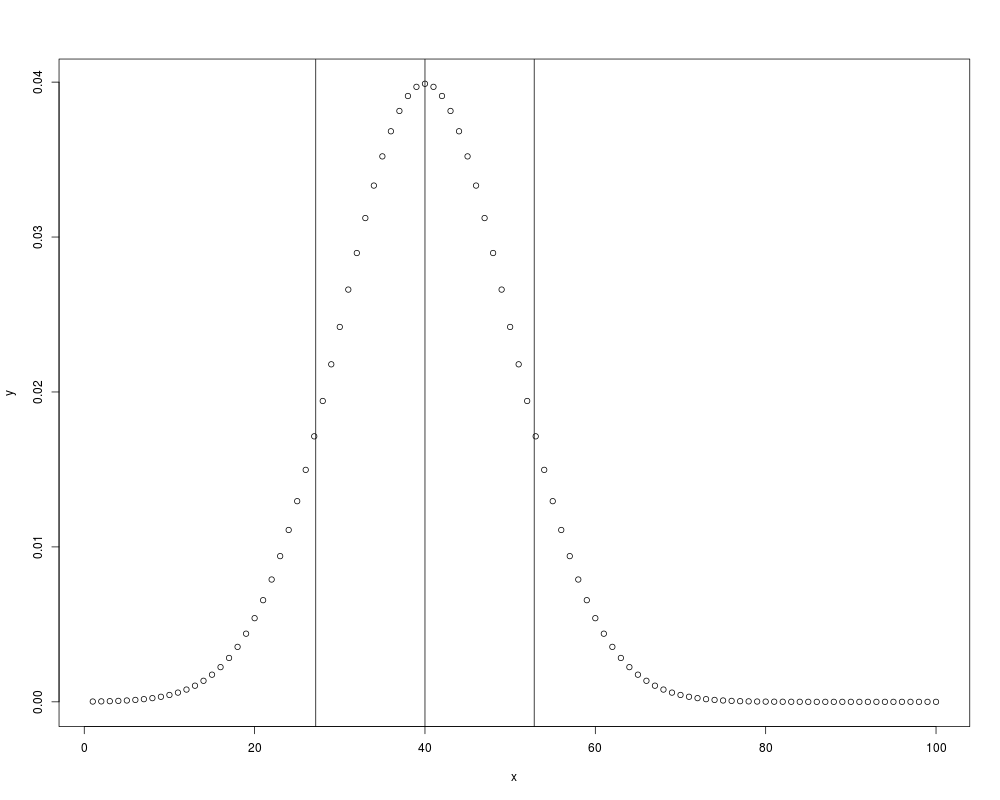
Examples# make up some x-y data x <- seq(1,100) y <- dnorm(x, mean=40, sd=10) plot(x,y) # mark the median, 0.1 and 0.9 positions with vertical lines abline(v=per(y,x,0.5)) abline(v=per(y,x,0.9)) abline(v=per(y,x,0.1)) # for a bimodal distribution which doesn't sum to one x <- c(1:5) y <- c(2,3,4,3,4) per(y,x,0.5) # should return 3.25 # change the previous example to bin extremes x <- c(1:6) per(y,x,0.5) # should return 3.75 Results
R version 3.3.1 (2016-06-21) -- "Bug in Your Hair"
Copyright (C) 2016 The R Foundation for Statistical Computing
Platform: x86_64-pc-linux-gnu (64-bit)

R is free software and comes with ABSOLUTELY NO WARRANTY.
You are welcome to redistribute it under certain conditions.
Type 'license()' or 'licence()' for distribution details.

R is a collaborative project with many contributors.
Type 'contributors()' for more information and
'citation()' on how to cite R or R packages in publications.

Type 'demo()' for some demos, 'help()' for on-line help, or
'help.start()' for an HTML browser interface to help.
Type 'q()' to quit R.

> library(GenKern)
Loading required package: KernSmooth
KernSmooth 2.23 loaded
Copyright M. P. Wand 1997-2009
> png(filename="/home/ddbj/snapshot/RGM3/R_CC/result/GenKern/per.Rd_%03d_medium.png", width=480, height=480)
> ### Name: per
> ### Title: Locate value for ith percentage point in a binned distribution
> ### Aliases: per
> ### Keywords: nonparametric
>
> ### ** Examples
>
> # make up some x-y data
> x <- seq(1,100)
> y <- dnorm(x, mean=40, sd=10)
> plot(x,y)
> # mark the median, 0.1 and 0.9 positions with vertical lines
> abline(v=per(y,x,0.5))
> abline(v=per(y,x,0.9))
> abline(v=per(y,x,0.1))
> # for a bimodal distribution which doesn't sum to one
> x <- c(1:5)
> y <- c(2,3,4,3,4)
> per(y,x,0.5) # should return 3.25
[1] 3.25
> # change the previous example to bin extremes
> x <- c(1:6)
> per(y,x,0.5) # should return 3.75
[1] 3.75
>
>
>
>
>
> dev.off()
null device
          1
>
|