Object of class data frame representing annotated mutations. The
data frame supplied must have one of the following sets of column names
("Tumor_Sample_Barcode", "Hugo_Symbol", "Variant_Classification") for
fileType="MAF", ("sample","gene_name","trv_type") for fileType="MGI" or
("sample", "gene", "variant_class") for fileType="Custom". This columns
should represent samples in a cohort, gene with mutation, and the mutation
type respectively.
mainRecurCutoff
Numeric value between 0 and 1 specifying a
mutation recurrence cutoff. Genes which do not have mutations in the
proportion os samples defined are removed.
mainGrid
Boolean specifying if a grid should be overlayed on the main
plot. Not recommended if the number of genes or samples to be plotted
is large.
mainXlabel
Boolean specifying whether to label the x-axis with sample
names. Not recommended if the number of samples to be plotted is large.
main_geneLabSize
Intenger specifying the size of gene names displayed
on the y-axis.
mainLabelCol
Character string specifying a column name from the
argument supplied to parameter 'x' from which to derive cell labels from
(see details and vignette).
mainLabelSize
Integer specifying the size of text labels for cells
in the main plot. Valid only if argument is supplied to the parameter
'mainLabelCol'.
mainLabelAngle
Integer specifying the degree of rotation for
text labels. Valid only if argument is supplied to the parameter
'mainLabelCol'.
mainDropMut
Boolean specifying whether to drop unused
"mutation type" levels from the legend.
mainPalette
Character vector specifying colours for mutation types
plotted in the main plot, must specify a colour for each mutation type
plotted.
mainLayer
Valid ggplot2 layer to be added to the main plot.
mutBurden
Object of class data frame containing columns "sample",
"mut_burden" with sample levels matching those supplied in x.
plotMutBurden
Boolean specify if the mutation burden sub-plot should
be displayed.
coverageSpace
Integer specifying the size in bp of the genome
covered by sequence data from which mutations could be called
(see details and vignette).
mutBurdenLayer
Valid ggplot2 layer to be added to the top sub-plot.
clinData
Object of class data frame with rows representing clinical
data. The data frame should be in "long format" and columns must be names as
"sample", "variable", and "value" (optional see details and vignette).
clinLegCol
Integer specifying the number of columns in the legend for
the clinical data, only valid if argument is supplied to parameter clinData.
clinVarOrder
Character vector specifying the order in which to plot
variables in the variable column of the argument given to the parameter
clinData. The argument supplied to this parameter should have the same unique
length and values as in the variable column of the argument supplied to
parameter clinData (see vignette).
clinVarCol
Named character vector specifying the mapping of colours
to variables in the variable column of the data frame supplied to clinData
(ex. "variable"="colour").
clinLayer
Valid ggplot2 layer to be added to the clinical sub-plot.
sampRecurLayer
Valid ggplot2 layer to be added to the left sub-plot.
plotGenes
Character vector specifying genes to plot. If not null genes
not specified within this character vector are removed.
geneOrder
Character vector specifying the order in which to plot
genes.
plotSamples
Character vector specifying samples to plot. If not null
all other samples not specified within this parameter are removed.
sampOrder
Character vector specifying the order of the samples to
plot.
maxGenes
Integer specifying the maximum number of genes to be plotted.
Genes kept will be choosen based on the reccurence of mutations in samples.
rmvSilent
Boolean specifying if silent mutations should be removed
from the plot.
fileType
Character string specifying the file format of the data
frame specified to parameter 'x', one of "MGI", "MAF", "Custom"
(see details and vignette).
variant_class_order
Character vector specifying the hierarchical order
of mutation types to plot, required if file_type == "Custom"
(see details and vignette).
out
Character vector specifying the the object to output, one of
"data", "grob", or "plot", defaults to "plot" (see returns).
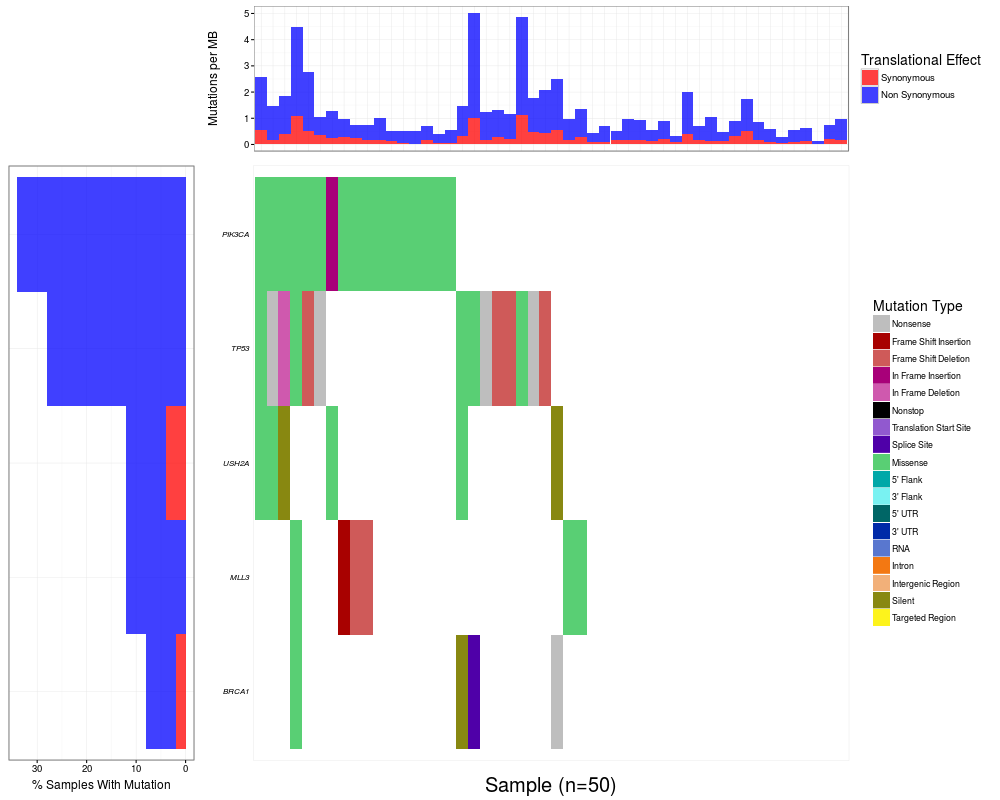
Details
waterfall is a function designed to visualize the mutations seen in
a cohort. The function takes a data frame with appropriate column names (see
fileType parameter) and plots the mutations within. In cases where multiple
mutations occur in the same cell the most deleterious mutation is given
priority (see vignette for default priority). If the fileType parameter is
set to "Custom" the user most supply this priority via the
'variant_class_order' parameter with the highest priorities occuring first.
Additionally this parameter will override the default orders of MGI and MAF
file types.
Various data subsets are allowed via the waterfall function (see above), all
of these subsets will occur independently of the mutation burden calculation.
To clarify the removal of genes and mutations will only occur after the
mutation burden is calculated. The mutation burden calculation is only meant
to provide a rough estimate and assumes that the coverage breadth within the
cohort is aproximately equal. For more accurate calculations it is
recommended to supply this information via the mutBurden parameter which.
Note that the mutation burden calculation relies on the 'coverageSpace'
parameter (see vignette).
It is possible to display additional information within the plot via cell
labels. The 'mainLabelCol' parameter will look for an additional column in
the data frame and plot text within cells based on those values
(see vignette).
Value
One of the following, a list of dataframes containing data to be
plotted, a grob object, or a plot.
Examples
# Plot the data
waterfall(brcaMAF, plotGenes=c("PIK3CA", "TP53", "USH2A", "MLL3", "BRCA1"))
Results
R version 3.3.1 (2016-06-21) -- "Bug in Your Hair"
Copyright (C) 2016 The R Foundation for Statistical Computing
Platform: x86_64-pc-linux-gnu (64-bit)

R is free software and comes with ABSOLUTELY NO WARRANTY.
You are welcome to redistribute it under certain conditions.
Type 'license()' or 'licence()' for distribution details.

R is a collaborative project with many contributors.
Type 'contributors()' for more information and
'citation()' on how to cite R or R packages in publications.

Type 'demo()' for some demos, 'help()' for on-line help, or
'help.start()' for an HTML browser interface to help.
Type 'q()' to quit R.

> library(GenVisR)
> png(filename="/home/ddbj/snapshot/RGM3/R_BC/result/GenVisR/waterfall.Rd_%03d_medium.png", width=480, height=480)
> ### Name: waterfall
> ### Title: Construct a waterfall plot
> ### Aliases: waterfall
>
> ### ** Examples
>
> # Plot the data
> waterfall(brcaMAF, plotGenes=c("PIK3CA", "TP53", "USH2A", "MLL3", "BRCA1"))
Checking if input is properly formatted...
Calculating frequency of mutations...
Removing genes not in: PIK3CA, TP53, USH2A, MLL3, BRCA1
setting mutation hierarchy...
NULL
>
>
>
>
>
> dev.off()
null device
          1
>
 .
.