Supported by Dr. Osamu Ogasawara and  . . |
|
Last data update: 2014.03.03 |
Average Periodogram for Multiple (Genetic) Time SeriesDescription
Usageavgp(x, title = deparse(substitute(x)), plot = TRUE, angular = FALSE, ...) Arguments
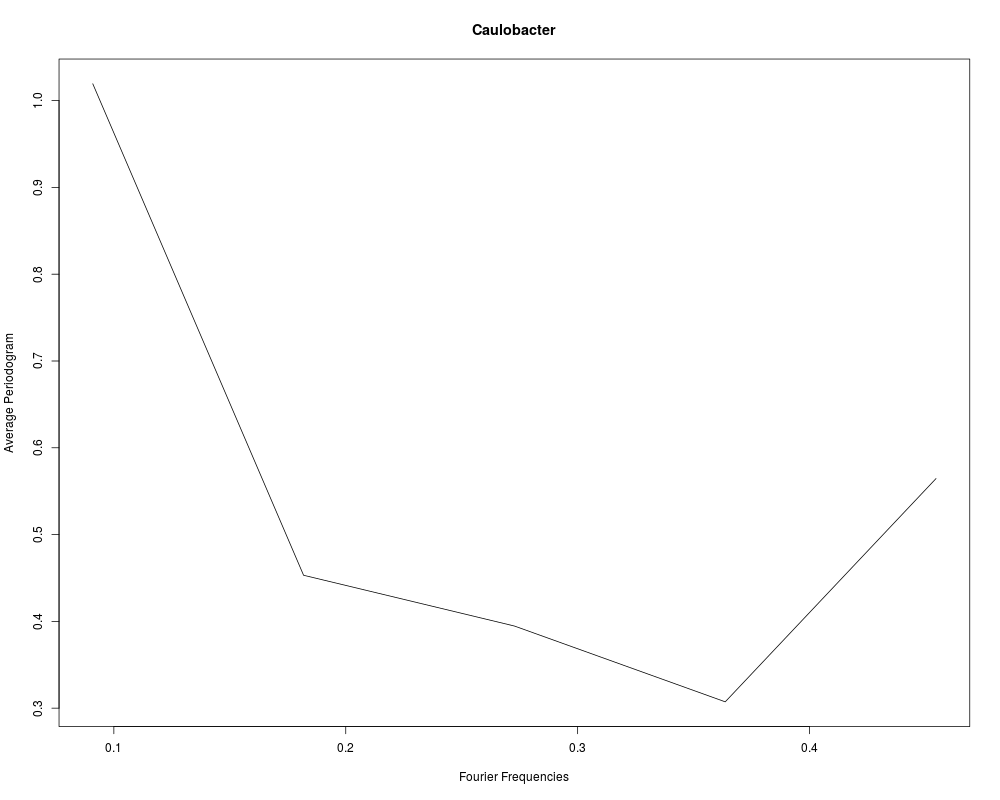
DetailsThe average periodogram is simply the frequency-wise average of the spectral density (as estimated
by the Fourier transform) over all times series.
To calculate the average periodogram the function ValueA list object with the following components:
The result is returned invisibly if Author(s)Konstantinos Fokianos (http://www.ucy.ac.cy/~fokianos/) and Korbinian Strimmer (http://strimmerlab.org). ReferencesWichert, S., Fokianos, K., and Strimmer, K. (2004). Identifying periodically expressed transcripts in microarray time series data. Bioinformatics 20:5-20. See Also
Examples
# load GeneCycle library
library("GeneCycle")

# load data set
data(caulobacter)

# how many samples and how many genes?
dim(caulobacter)

# average periodogram
avgp.caulobacter <- avgp(caulobacter, "Caulobacter")
avgp.caulobacter

# just compute and don't plot
avgp(caulobacter, "Caulobacter", plot=FALSE)
Results
R version 3.3.1 (2016-06-21) -- "Bug in Your Hair"
Copyright (C) 2016 The R Foundation for Statistical Computing
Platform: x86_64-pc-linux-gnu (64-bit)

R is free software and comes with ABSOLUTELY NO WARRANTY.
You are welcome to redistribute it under certain conditions.
Type 'license()' or 'licence()' for distribution details.

R is a collaborative project with many contributors.
Type 'contributors()' for more information and
'citation()' on how to cite R or R packages in publications.

Type 'demo()' for some demos, 'help()' for on-line help, or
'help.start()' for an HTML browser interface to help.
Type 'q()' to quit R.

> library(GeneCycle)
Loading required package: MASS
Loading required package: longitudinal
Loading required package: corpcor
Loading required package: fdrtool
> png(filename="/home/ddbj/snapshot/RGM3/R_CC/result/GeneCycle/avpg.Rd_%03d_medium.png", width=480, height=480)
> ### Name: avgp
> ### Title: Average Periodogram for Multiple (Genetic) Time Series
> ### Aliases: avgp avpg
> ### Keywords: ts
>
> ### ** Examples
>
> # load GeneCycle library
> library("GeneCycle")
>
> # load data set
> data(caulobacter)
>
> # how many samples and how many genes?
> dim(caulobacter)
[1]   11 1444
>
> # average periodogram
> avgp.caulobacter <- avgp(caulobacter, "Caulobacter")
> avgp.caulobacter
$freq
[1] 0.09090909 0.18181818 0.27272727 0.36363636 0.45454545

$avg.spec
[1] 1.0194294 0.4531051 0.3946281 0.3072837 0.5645783

$title
[1] "Caulobacter"

>
> # just compute and don't plot
> avgp(caulobacter, "Caulobacter", plot=FALSE)
$freq
[1] 0.09090909 0.18181818 0.27272727 0.36363636 0.45454545

$avg.spec
[1] 1.0194294 0.4531051 0.3946281 0.3072837 0.5645783

$title
[1] "Caulobacter"

>
>
>
>
>
> dev.off()
null device
          1
>
|