Supported by Dr. Osamu Ogasawara and  . . |
|
Last data update: 2014.03.03 |
A Flexible Order Restricted Hypothesis TestingDescriptionThese functions test the hypothesis regarding population means from ordered sample groups. Restrictions like a weakly/general/strongly isotonic/monotonic order as well as a lower bound for the location can be imposed on the population means. A partition of sample groups and the corresponding estimates of population means are also provided. Usageflexisoreg(y, x, lambda = 0, alpha.location = 1, alpha.adjacency = 0.5) flexisoreg.stat(y, x, lambda = 0, alpha.location = 1, alpha.adjacency = 0.5) flexmonoreg(y, x, lambda = 0, alpha.location = 1, alpha.adjacency = 0.5) flexmonoreg.stat(y, x, lambda = 0, alpha.location = 1, alpha.adjacency = 0.5) Arguments
Details
Value
NoteSince the p-value of test has to be evaluated by permutation method, these functions will not return any p-value. For the permutation p-value of an individual test, see Author(s)Yinglei Lai ylai@gwu.edu ReferencesYinglei Lai (2007) A flexible order restricted hypothesis testing and its application to gene expression data. Technical Report Examples
#generate ordinal group lables x
x <- runif(100)*6
x <- round(x,0)/3
#generate true values z
z <- round(x^2,0)
#generate observed values y
y <- z + rnorm(100)
#print default results
print(rbind(x,z,y))
print(flexisoreg(y,x))
print(flexisoreg.stat(y,x))
print(flexisoreg(y,0-x))
print(flexisoreg.stat(y,0-x))
print(flexmonoreg(y,x))
print(flexmonoreg.stat(y,x))
#plots for illustration
par(mfrow=c(2,3), mai=c(0.6, 0.6, 0.3, 0.1))
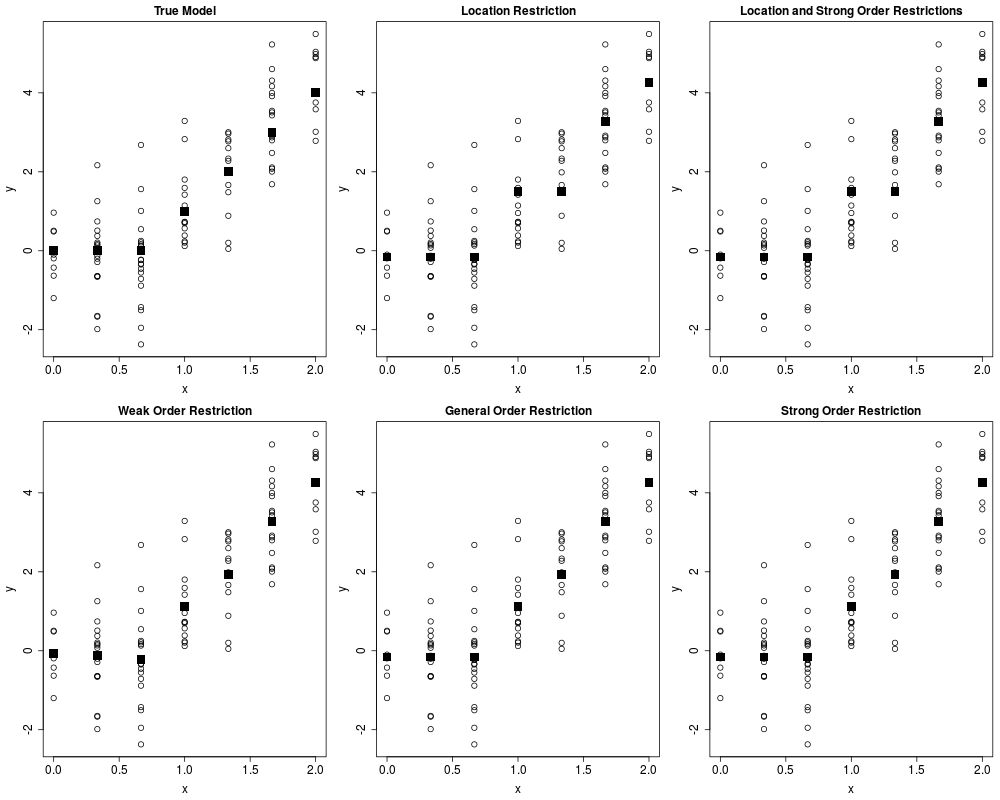
plot(x,y, main="True Model",cex.axis=1.5, cex.lab=1.5, cex.main=1.5, cex=1.5)
lines(x, z, type="p", pch=15, col="black", cex=2.5)
results <- flexisoreg(y, x, lambda=1, alpha.location=0.05, alpha.adjacency=1)
plot(x,y, main="Location Restriction",cex.axis=1.5, cex.lab=1.5, cex.main=1.5, cex=1.5)
lines(x, results$estimate, type="p", pch=15, col="black", cex=2.5)
results <- flexisoreg(y, x, lambda=1, alpha.location=0.05, alpha.adjacency=0.05)
plot(x,y, main="Location and Strong Order Restrictions",cex.axis=1.5, cex.lab=1.5, cex.main=1.5, cex=1.5)
lines(x, results$estimate, type="p", pch=15, col="black", cex=2.5)
results <- flexisoreg(y, x, lambda=0, alpha.location=1, alpha.adjacency=0.95)
plot(x,y, main="Weak Order Restriction",cex.axis=1.5, cex.lab=1.5, cex.main=1.5, cex=1.5)
lines(x, results$estimate, type="p", pch=15, col="black", cex=2.5)
results <- flexisoreg(y, x, lambda=0, alpha.location=1, alpha.adjacency=0.5)
plot(x,y, main="General Order Restriction",cex.axis=1.5, cex.lab=1.5, cex.main=1.5, cex=1.5)
lines(x, results$estimate, type="p", pch=15, col="black", cex=2.5)
results <- flexisoreg(y, x, lambda=0, alpha.location=1, alpha.adjacency=0.05)
plot(x,y, main="Strong Order Restriction",cex.axis=1.5, cex.lab=1.5, cex.main=1.5, cex=1.5)
lines(x, results$estimate, type="p", pch=15, col="black", cex=2.5)
Results
R version 3.3.1 (2016-06-21) -- "Bug in Your Hair"
Copyright (C) 2016 The R Foundation for Statistical Computing
Platform: x86_64-pc-linux-gnu (64-bit)

R is free software and comes with ABSOLUTELY NO WARRANTY.
You are welcome to redistribute it under certain conditions.
Type 'license()' or 'licence()' for distribution details.

R is a collaborative project with many contributors.
Type 'contributors()' for more information and
'citation()' on how to cite R or R packages in publications.

Type 'demo()' for some demos, 'help()' for on-line help, or
'help.start()' for an HTML browser interface to help.
Type 'q()' to quit R.

> library(GeneF)
> png(filename="/home/ddbj/snapshot/RGM3/R_CC/result/GeneF/flexorhtest.Rd_%03d_medium.png", width=480, height=480)
> ### Name: flexorhtest
> ### Title: A Flexible Order Restricted Hypothesis Testing
> ### Aliases: flexisoreg flexisoreg.stat flexmonoreg flexmonoreg.stat
> ### Keywords: htest
>
> ### ** Examples
>
> #generate ordinal group lables x
> x <- runif(100)*6
> x <- round(x,0)/3
> #generate true values z
> z <- round(x^2,0)
> #generate observed values y
> y <- z + rnorm(100)
>
>
> #print default results
> print(rbind(x,z,y))
      [,1]       [,2]     [,3]     [,4]      [,5]       [,6]     [,7]     [,8]
x 1.333333  0.3333333 1.666667 0.000000 0.0000000  0.6666667 2.000000 1.666667
z 2.000000  0.0000000 3.000000 0.000000 0.0000000  0.0000000 4.000000 3.000000
y 3.954824 -0.4931103 4.327530 0.561059 0.3125214 -0.1879438 4.555924 4.087106
      [,9]     [,10]      [,11]    [,12]    [,13]     [,14]     [,15]    [,16]
x 1.333333 0.3333333  0.0000000 1.666667 1.333333 0.3333333 0.3333333 1.666667
z 2.000000 0.0000000  0.0000000 3.000000 2.000000 0.0000000 0.0000000 3.000000
y 2.855751 0.8457317 -0.8099812 2.624367 1.690692 0.2848893 0.6747401 4.003615
      [,17]    [,18]     [,19]    [,20]     [,21]    [,22]      [,23]    [,24]
x 1.0000000 0.000000 1.0000000 2.000000 1.0000000 1.333333  0.6666667 1.000000
z 1.0000000 0.000000 1.0000000 4.000000 1.0000000 2.000000  0.0000000 1.000000
y 0.3743444 2.040277 0.0432033 3.139623 0.7679905 2.016206 -0.1158910 1.361559
      [,25]    [,26]     [,27]     [,28]    [,29]    [,30]    [,31]     [,32]
x 0.3333333 0.000000 0.6666667  1.000000 2.000000 1.000000 1.666667 0.3333333
z 0.0000000 0.000000 0.0000000  1.000000 4.000000 1.000000 3.000000 0.0000000
y 2.2216767 1.511565 0.9527615 -1.602994 3.454197 1.876169 2.359285 1.0802786
     [,33]    [,34]    [,35]      [,36]     [,37]     [,38]    [,39]     [,40]
x 1.333333 1.666667 2.000000  0.6666667 0.3333333 0.3333333 1.000000 1.0000000
z 2.000000 3.000000 4.000000  0.0000000 0.0000000 0.0000000 1.000000 1.0000000
y 3.314871 3.663193 2.258761 -1.2860548 0.2386168 1.6961252 1.243523 0.1809188
     [,41]      [,42]      [,43]       [,44]    [,45]    [,46]    [,47]
x 2.000000  1.0000000  0.3333333  0.00000000 1.666667 1.666667 1.666667
z 4.000000  1.0000000  0.0000000  0.00000000 3.000000 3.000000 3.000000
y 4.971262 -0.1721532 -1.7236983 -0.02091077 2.804276 2.207975 4.505615
     [,48]       [,49]    [,50]    [,51]    [,52]     [,53]    [,54]      [,55]
x 2.000000  0.33333333 2.000000 1.333333 1.000000 0.3333333 1.333333 0.66666667
z 4.000000  0.00000000 4.000000 2.000000 1.000000 0.0000000 2.000000 0.00000000
y 3.313578 -0.01713172 3.599861 2.793036 2.102819 1.1560515 0.694545 0.02416077
       [,56]      [,57]    [,58]     [,59]      [,60]     [,61]     [,62]
x  0.6666667  0.3333333 1.666667 0.3333333  0.6666667 0.6666667 1.3333333
z  0.0000000  0.0000000 3.000000 0.0000000  0.0000000 0.0000000 2.0000000
y -1.9346159 -1.2754496 1.865765 0.3941875 -1.6370568 1.1349411 0.8663364
       [,63]     [,64]    [,65]    [,66]     [,67]      [,68]    [,69]
x 0.00000000 1.0000000 1.000000 1.333333 0.6666667  0.3333333 1.333333
z 0.00000000 1.0000000 1.000000 2.000000 0.0000000  0.0000000 2.000000
y 0.07803082 0.5243316 2.540465 2.302328 1.1638641 -1.1384808 3.133318
       [,70]      [,71]      [,72]    [,73]    [,74]    [,75]      [,76]
x  0.0000000 0.00000000  0.6666667 1.333333 2.000000 1.666667  0.6666667
z  0.0000000 0.00000000  0.0000000 2.000000 4.000000 3.000000  0.0000000
y -0.4857579 0.05552159 -0.1200770 1.868358 3.752834 1.366348 -0.2809526
      [,77]   [,78]    [,79]    [,80]    [,81]      [,82]    [,83]    [,84]
x 0.6666667  1.0000 2.000000 2.000000 1.666667  1.3333333 1.666667 1.333333
z 0.0000000  1.0000 4.000000 4.000000 3.000000  2.0000000 3.000000 2.000000
y 0.8976962 -0.3948 2.126788 3.003348 3.711032 -0.5632653 3.345419 1.302680
       [,85]     [,86]    [,87]      [,88]      [,89]    [,90]    [,91]
x  0.6666667 1.3333333 2.000000  1.0000000  0.6666667 2.000000 1.666667
z  0.0000000 2.0000000 4.000000  1.0000000  0.0000000 4.000000 3.000000
y -0.5557990 0.3857654 3.574294 -0.9636202 -1.4468890 4.468037 2.917692
      [,92]    [,93]    [,94]    [,95]    [,96]     [,97]    [,98]    [,99]
x 1.3333333 1.333333 1.666667 1.000000 1.333333 1.0000000 1.666667 1.333333
z 2.0000000 2.000000 3.000000 1.000000 2.000000 1.0000000 3.000000 2.000000
y 0.5087202 3.239967 4.694173 1.122423 1.888748 0.3279522 2.593387 1.804192
    [,100]
x 1.333333
z 2.000000
y 1.440315
> print(flexisoreg(y,x))
$groups
  [1] 3 1 4 1 1 1 5 4 3 1 1 4 3 1 1 4 2 1 2 5 2 3 1 2 1 1 1 2 5 2 4 1 3 4 5 1 1
 [38] 1 2 2 5 2 1 1 4 4 4 5 1 5 3 2 1 3 1 1 1 4 1 1 1 3 1 2 2 3 1 1 3 1 1 1 3 5
 [75] 4 1 1 2 5 5 4 3 4 3 1 3 5 2 1 5 4 3 3 4 2 3 2 4 3 3

$estimates
  [1] 1.8682836 0.1025647 3.1922987 0.1025647 0.1025647 0.1025647 3.5182090
  [8] 3.1922987 1.8682836 0.1025647 0.1025647 3.1922987 1.8682836 0.1025647
 [15] 0.1025647 3.1922987 0.5832582 0.1025647 0.5832582 3.5182090 0.5832582
 [22] 1.8682836 0.1025647 0.5832582 0.1025647 0.1025647 0.1025647 0.5832582
 [29] 3.5182090 0.5832582 3.1922987 0.1025647 1.8682836 3.1922987 3.5182090
 [36] 0.1025647 0.1025647 0.1025647 0.5832582 0.5832582 3.5182090 0.5832582
 [43] 0.1025647 0.1025647 3.1922987 3.1922987 3.1922987 3.5182090 0.1025647
 [50] 3.5182090 1.8682836 0.5832582 0.1025647 1.8682836 0.1025647 0.1025647
 [57] 0.1025647 3.1922987 0.1025647 0.1025647 0.1025647 1.8682836 0.1025647
 [64] 0.5832582 0.5832582 1.8682836 0.1025647 0.1025647 1.8682836 0.1025647
 [71] 0.1025647 0.1025647 1.8682836 3.5182090 3.1922987 0.1025647 0.1025647
 [78] 0.5832582 3.5182090 3.5182090 3.1922987 1.8682836 3.1922987 1.8682836
 [85] 0.1025647 1.8682836 3.5182090 0.5832582 0.1025647 3.5182090 3.1922987
 [92] 1.8682836 1.8682836 3.1922987 0.5832582 1.8682836 0.5832582 3.1922987
 [99] 1.8682836 1.8682836

$statistic
[1] 26.5113

> print(flexisoreg.stat(y,x))
[1] 26.5113
> print(flexisoreg(y,0-x))
$groups
  [1] 1 1 1 1 1 1 1 1 1 1 1 1 1 1 1 1 1 1 1 1 1 1 1 1 1 1 1 1 1 1 1 1 1 1 1 1 1
 [38] 1 1 1 1 1 1 1 1 1 1 1 1 1 1 1 1 1 1 1 1 1 1 1 1 1 1 1 1 1 1 1 1 1 1 1 1 1
 [75] 1 1 1 1 1 1 1 1 1 1 1 1 1 1 1 1 1 1 1 1 1 1 1 1 1 1

$estimates
  [1] 1.419197 1.419197 1.419197 1.419197 1.419197 1.419197 1.419197 1.419197
  [9] 1.419197 1.419197 1.419197 1.419197 1.419197 1.419197 1.419197 1.419197
 [17] 1.419197 1.419197 1.419197 1.419197 1.419197 1.419197 1.419197 1.419197
 [25] 1.419197 1.419197 1.419197 1.419197 1.419197 1.419197 1.419197 1.419197
 [33] 1.419197 1.419197 1.419197 1.419197 1.419197 1.419197 1.419197 1.419197
 [41] 1.419197 1.419197 1.419197 1.419197 1.419197 1.419197 1.419197 1.419197
 [49] 1.419197 1.419197 1.419197 1.419197 1.419197 1.419197 1.419197 1.419197
 [57] 1.419197 1.419197 1.419197 1.419197 1.419197 1.419197 1.419197 1.419197
 [65] 1.419197 1.419197 1.419197 1.419197 1.419197 1.419197 1.419197 1.419197
 [73] 1.419197 1.419197 1.419197 1.419197 1.419197 1.419197 1.419197 1.419197
 [81] 1.419197 1.419197 1.419197 1.419197 1.419197 1.419197 1.419197 1.419197
 [89] 1.419197 1.419197 1.419197 1.419197 1.419197 1.419197 1.419197 1.419197
 [97] 1.419197 1.419197 1.419197 1.419197

$statistic
[1] 0

> print(flexisoreg.stat(y,0-x))
[1] 0
> print(flexmonoreg(y,x))
$groups
  [1] 3 1 4 1 1 1 5 4 3 1 1 4 3 1 1 4 2 1 2 5 2 3 1 2 1 1 1 2 5 2 4 1 3 4 5 1 1
 [38] 1 2 2 5 2 1 1 4 4 4 5 1 5 3 2 1 3 1 1 1 4 1 1 1 3 1 2 2 3 1 1 3 1 1 1 3 5
 [75] 4 1 1 2 5 5 4 3 4 3 1 3 5 2 1 5 4 3 3 4 2 3 2 4 3 3

$estimates
  [1] 1.8682836 0.1025647 3.1922987 0.1025647 0.1025647 0.1025647 3.5182090
  [8] 3.1922987 1.8682836 0.1025647 0.1025647 3.1922987 1.8682836 0.1025647
 [15] 0.1025647 3.1922987 0.5832582 0.1025647 0.5832582 3.5182090 0.5832582
 [22] 1.8682836 0.1025647 0.5832582 0.1025647 0.1025647 0.1025647 0.5832582
 [29] 3.5182090 0.5832582 3.1922987 0.1025647 1.8682836 3.1922987 3.5182090
 [36] 0.1025647 0.1025647 0.1025647 0.5832582 0.5832582 3.5182090 0.5832582
 [43] 0.1025647 0.1025647 3.1922987 3.1922987 3.1922987 3.5182090 0.1025647
 [50] 3.5182090 1.8682836 0.5832582 0.1025647 1.8682836 0.1025647 0.1025647
 [57] 0.1025647 3.1922987 0.1025647 0.1025647 0.1025647 1.8682836 0.1025647
 [64] 0.5832582 0.5832582 1.8682836 0.1025647 0.1025647 1.8682836 0.1025647
 [71] 0.1025647 0.1025647 1.8682836 3.5182090 3.1922987 0.1025647 0.1025647
 [78] 0.5832582 3.5182090 3.5182090 3.1922987 1.8682836 3.1922987 1.8682836
 [85] 0.1025647 1.8682836 3.5182090 0.5832582 0.1025647 3.5182090 3.1922987
 [92] 1.8682836 1.8682836 3.1922987 0.5832582 1.8682836 0.5832582 3.1922987
 [99] 1.8682836 1.8682836

$statistic
[1] 26.5113

> print(flexmonoreg.stat(y,x))
[1] 26.5113
>
>
>      #plots for illustration
>      par(mfrow=c(2,3), mai=c(0.6, 0.6, 0.3, 0.1))
>      plot(x,y, main="True Model",cex.axis=1.5, cex.lab=1.5, cex.main=1.5, cex=1.5)
>      lines(x, z, type="p", pch=15, col="black", cex=2.5)
>
>      results <- flexisoreg(y, x, lambda=1, alpha.location=0.05, alpha.adjacency=1)
>      plot(x,y, main="Location Restriction",cex.axis=1.5, cex.lab=1.5, cex.main=1.5, cex=1.5)
>      lines(x, results$estimate, type="p", pch=15, col="black", cex=2.5)
>
>      results <- flexisoreg(y, x, lambda=1, alpha.location=0.05, alpha.adjacency=0.05)
>      plot(x,y, main="Location and Strong Order Restrictions",cex.axis=1.5, cex.lab=1.5, cex.main=1.5, cex=1.5)
>      lines(x, results$estimate, type="p", pch=15, col="black", cex=2.5)
>
>      results <- flexisoreg(y, x, lambda=0, alpha.location=1, alpha.adjacency=0.95)
>      plot(x,y, main="Weak Order Restriction",cex.axis=1.5, cex.lab=1.5, cex.main=1.5, cex=1.5)
>      lines(x, results$estimate, type="p", pch=15, col="black", cex=2.5)
>
>      results <- flexisoreg(y, x, lambda=0, alpha.location=1, alpha.adjacency=0.5)
>      plot(x,y, main="General Order Restriction",cex.axis=1.5, cex.lab=1.5, cex.main=1.5, cex=1.5)
>      lines(x, results$estimate, type="p", pch=15, col="black", cex=2.5)
>
>      results <- flexisoreg(y, x, lambda=0, alpha.location=1, alpha.adjacency=0.05)
>      plot(x,y, main="Strong Order Restriction",cex.axis=1.5, cex.lab=1.5, cex.main=1.5, cex=1.5)
>      lines(x, results$estimate, type="p", pch=15, col="black", cex=2.5)
>
>
>
>
>
>
> dev.off()
null device
          1
>
|