Supported by Dr. Osamu Ogasawara and  . . |
|
Last data update: 2014.03.03 |
Significance Assessment for the Flexible Order Restricted Hypothesis TestingDescriptionThese functions evaluate the p-values from an individual or multiple flexible order restricted hypothesis testing. Usageflexisoreg.pvalue(y, x, lambda=0, alpha.location=1, alpha.adjacency=0.5, B=100) flexisoreg.poolpvalues(m, x, lambda=0, alpha.location=1, alpha.adjacency=0.5, B=100) flexmonoreg.pvalue(y, x, lambda=0, alpha.location=1, alpha.adjacency=0.5, B=100) flexmonoreg.poolpvalues(m, x, lambda=0, alpha.location=1, alpha.adjacency=0.5, B=100) Arguments
Details
Value
NoteThese functions are used in conjunction with Author(s)Yinglei Lai ylai@gwu.edu ReferencesYinglei Lai (2007) A flexible order restricted hypothesis testing and its application to gene expression data. Technical Report Examples
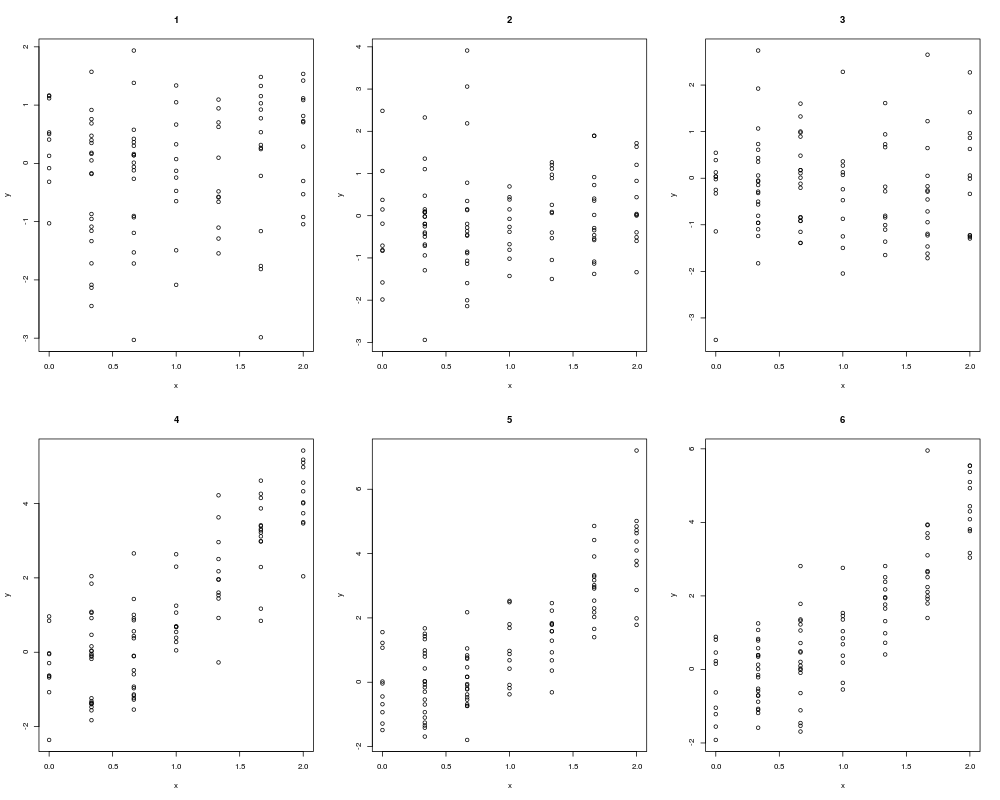
#generate ordinal group lables x
x <- runif(100)*6
x <- round(x,0)/3
#generate true values z
z <- round(x^2,0)
#generate 6 vectors in a matrix for observed values, some noises and some not
m <- array(double(6*100), dim=c(6,100))
for(k in 1:3)
m[k,] <- rnorm(100)
for(k in 4:6)
m[k,] <- z + rnorm(100)


#print default results
par(mfrow=c(2,3))
for(k in 1:6){
print(paste("The ", k, "-th vector", sep=""))
y <- m[k,]
plot(x,y,main=k)
print(flexisoreg.stat(y,x))
print(flexisoreg.pvalue(y,x,B=20))
print(flexisoreg.stat(y,0-x))
print(flexisoreg.pvalue(y,0-x,B=20))
print(flexmonoreg.stat(y,x))
print(flexmonoreg.pvalue(y,x,B=20))
}

flexisoreg.poolpvalues(m, x, B=20)
flexmonoreg.poolpvalues(m, x, B=20)
Results
R version 3.3.1 (2016-06-21) -- "Bug in Your Hair"
Copyright (C) 2016 The R Foundation for Statistical Computing
Platform: x86_64-pc-linux-gnu (64-bit)

R is free software and comes with ABSOLUTELY NO WARRANTY.
You are welcome to redistribute it under certain conditions.
Type 'license()' or 'licence()' for distribution details.

R is a collaborative project with many contributors.
Type 'contributors()' for more information and
'citation()' on how to cite R or R packages in publications.

Type 'demo()' for some demos, 'help()' for on-line help, or
'help.start()' for an HTML browser interface to help.
Type 'q()' to quit R.

> library(GeneF)
> png(filename="/home/ddbj/snapshot/RGM3/R_CC/result/GeneF/flexorhtest.pvalue.Rd_%03d_medium.png", width=480, height=480)
> ### Name: flexorhtest.pvalue
> ### Title: Significance Assessment for the Flexible Order Restricted
> ###   Hypothesis Testing
> ### Aliases: flexisoreg.pvalue flexisoreg.poolpvalues flexmonoreg.pvalue
> ###   flexmonoreg.poolpvalues
> ### Keywords: htest
>
> ### ** Examples
>
> #generate ordinal group lables x
> x <- runif(100)*6
> x <- round(x,0)/3
> #generate true values z
> z <- round(x^2,0)
> #generate 6 vectors in a matrix for observed values, some noises and some not
> m <- array(double(6*100), dim=c(6,100))
> for(k in 1:3)
+ m[k,] <- rnorm(100)
> for(k in 4:6)
+ m[k,] <- z + rnorm(100)
>
>
> #print default results
> par(mfrow=c(2,3))
> for(k in 1:6){
+ print(paste("The ", k, "-th vector", sep=""))
+ y <- m[k,]
+ plot(x,y,main=k)
+ print(flexisoreg.stat(y,x))
+ print(flexisoreg.pvalue(y,x,B=20))
+ print(flexisoreg.stat(y,0-x))
+ print(flexisoreg.pvalue(y,0-x,B=20))
+ print(flexmonoreg.stat(y,x))
+ print(flexmonoreg.pvalue(y,x,B=20))
+ }
[1] "The 1-th vector"
[1] 0.4020956
[1] 0.25
[1] 0.1290844
[1] 0.5
[1] 0.4020956
[1] 0.4
[1] "The 2-th vector"
[1] 0.08010791
[1] 0.75
[1] 0.2221289
[1] 0.45
[1] -0.2221289
[1] 0.6
[1] "The 3-th vector"
[1] 0.4696835
[1] 0.15
[1] 0.2088344
[1] 0.4
[1] 0.4696835
[1] 0.2
[1] "The 4-th vector"
[1] 25.84069
[1] 0
[1] 0
[1] 0.95
[1] 25.84069
[1] 0
[1] "The 5-th vector"
[1] 22.83906
[1] 0
[1] 0
[1] 0.9
[1] 22.83906
[1] 0
[1] "The 6-th vector"
[1] 29.50962
[1] 0
[1] 0
[1] 0.9
[1] 29.50962
[1] 0
>
> flexisoreg.poolpvalues(m, x, B=20)
[1] 0.1833333 0.5583333 0.1500000 0.0000000 0.0000000 0.0000000
> flexmonoreg.poolpvalues(m, x, B=20)
[1] 0.4833333 0.7750000 0.3583333 0.0000000 0.0000000 0.0000000
>
>
>
>
>
>
> dev.off()
null device
          1
>
|