Supported by Dr. Osamu Ogasawara and  . . |
|
Last data update: 2014.03.03 |
Moments and Mode of the Generalized Hyperbolic DistributionDescriptionFunctions to calculate the mean, variance, skewness, kurtosis and mode of a specific generalized hyperbolic distribution. Usage
ghypMean(mu = 0, delta = 1, alpha = 1, beta = 0, lambda = 1,
         param = c(mu, delta, alpha, beta, lambda))
ghypVar(mu = 0, delta = 1, alpha = 1, beta = 0, lambda = 1,
        param = c(mu, delta, alpha, beta, lambda))
ghypSkew(mu = 0, delta = 1, alpha = 1, beta = 0, lambda = 1,
         param = c(mu, delta, alpha, beta, lambda))
ghypKurt(mu = 0, delta = 1, alpha = 1, beta = 0, lambda = 1,
         param = c(mu, delta, alpha, beta, lambda))
ghypMode(mu = 0, delta = 1, alpha = 1, beta = 0, lambda = 1,
         param = c(mu, delta, alpha, beta, lambda))
Arguments
Value
The mode is found by a numerical optimisation using
The parameterization of the generalized hyperbolic distribution used
for these functions is the (alpha, beta) one. See
Author(s)David Scott d.scott@auckland.ac.nz, Thomas Tran ReferencesPrause, K. (1999) The generalized hyperbolic models: Estimation, financial derivatives and risk measurement. PhD Thesis, Mathematics Faculty, University of Freiburg. See Also
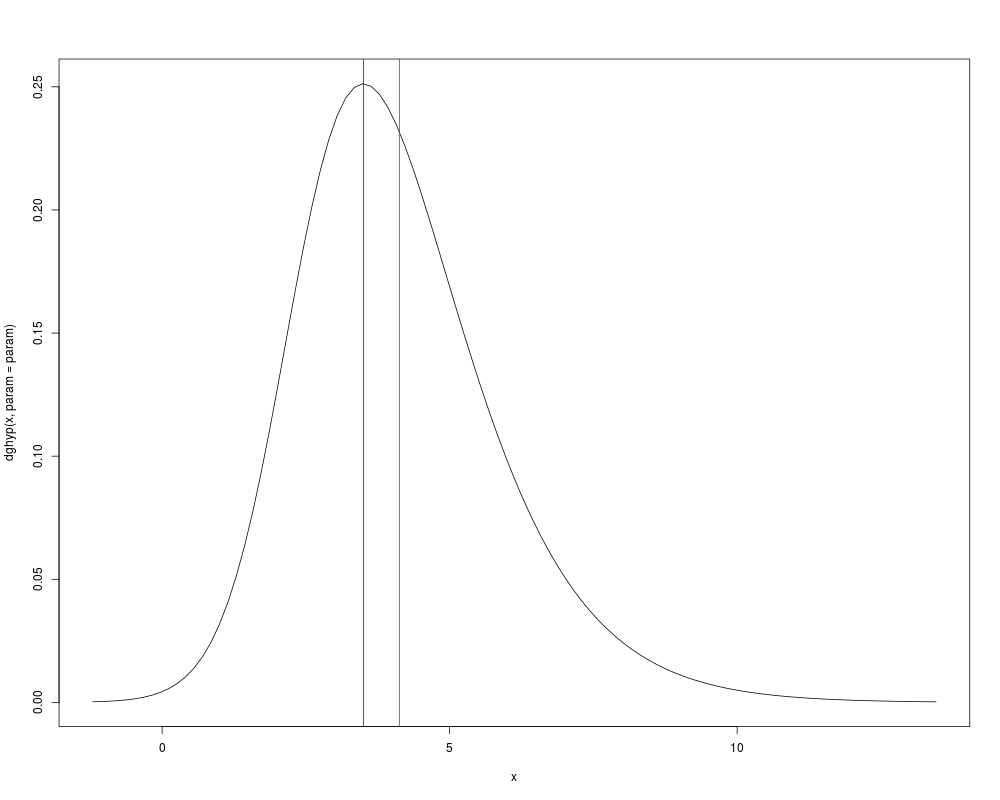
Examplesparam <- c(2, 2, 2, 1, 2) ghypMean(param = param) ghypVar(param = param) ghypSkew(param = param) ghypKurt(param = param) ghypMode(param = param) maxDens <- dghyp(ghypMode(param = param), param = param) ghypRange <- ghypCalcRange(param = param, tol = 10^(-3) * maxDens) curve(dghyp(x, param = param), ghypRange[1], ghypRange[2]) abline(v = ghypMode(param = param), col = "blue") abline(v = ghypMean(param = param), col = "red") Results
R version 3.3.1 (2016-06-21) -- "Bug in Your Hair"
Copyright (C) 2016 The R Foundation for Statistical Computing
Platform: x86_64-pc-linux-gnu (64-bit)

R is free software and comes with ABSOLUTELY NO WARRANTY.
You are welcome to redistribute it under certain conditions.
Type 'license()' or 'licence()' for distribution details.

R is a collaborative project with many contributors.
Type 'contributors()' for more information and
'citation()' on how to cite R or R packages in publications.

Type 'demo()' for some demos, 'help()' for on-line help, or
'help.start()' for an HTML browser interface to help.
Type 'q()' to quit R.

> library(GeneralizedHyperbolic)
Loading required package: DistributionUtils
Loading required package: RUnit
> png(filename="/home/ddbj/snapshot/RGM3/R_CC/result/GeneralizedHyperbolic/ghypMeanVarMode.Rd_%03d_medium.png", width=480, height=480)
> ### Name: Specific Generalized Hyperbolic Moments and Mode
> ### Title: Moments and Mode of the Generalized Hyperbolic Distribution
> ### Aliases: ghypMean ghypVar ghypSkew ghypKurt ghypMode
> ### Keywords: distribution
>
> ### ** Examples
>
> param <- c(2, 2, 2, 1, 2)
> ghypMean(param = param)
[1] 4.125532
> ghypVar(param = param)
[1] 3.192044
> ghypSkew(param = param)
[1] 0.7928604
> ghypKurt(param = param)
[1] 1.343511
> ghypMode(param = param)
[1] 3.499997
> maxDens <- dghyp(ghypMode(param = param), param = param)
> ghypRange <- ghypCalcRange(param = param, tol = 10^(-3) * maxDens)
> curve(dghyp(x, param = param), ghypRange[1], ghypRange[2])
> abline(v = ghypMode(param = param), col = "blue")
> abline(v = ghypMean(param = param), col = "red")
>
>
>
>
>
> dev.off()
null device
          1
>
|