Supported by Dr. Osamu Ogasawara and  . . |
|
Last data update: 2014.03.03 |
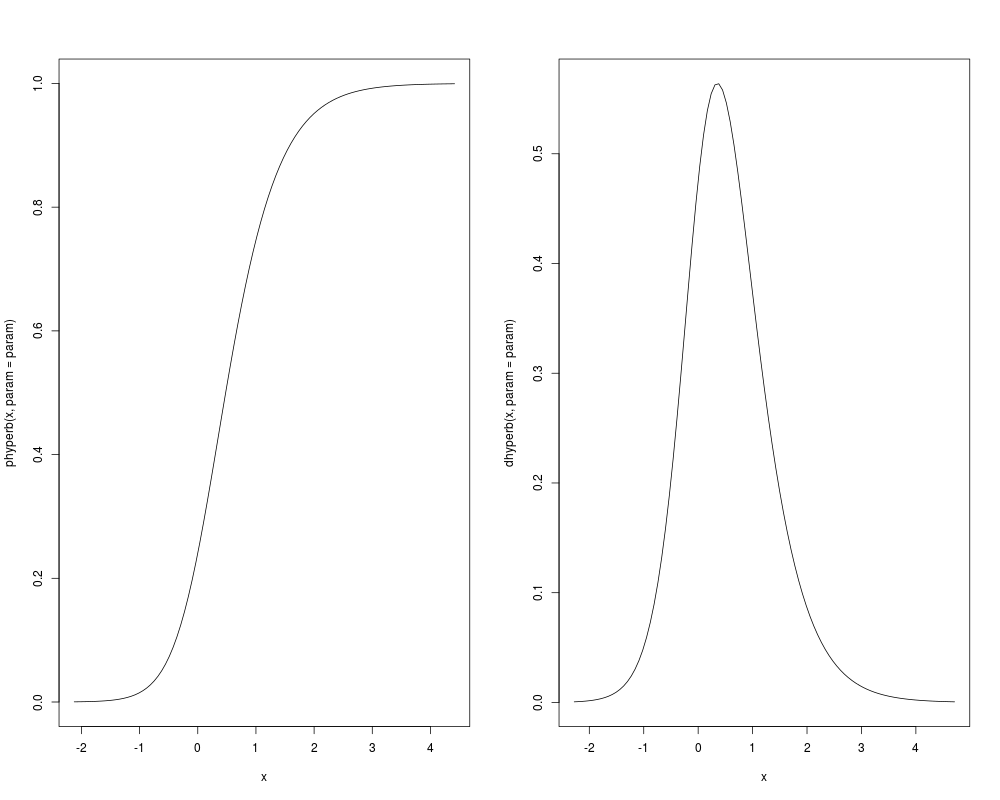
Range of a Hyperbolic DistributionDescriptionGiven the parameter vector param of a hyperbolic distribution,
this function calculates the range outside of which the distribution
has negligible probability, or the density function is negligible, to
a specified tolerance. The parameterization used
is the (alpha, beta) one (see
Usage
hyperbCalcRange(mu = 0, delta = 1, alpha = 1, beta = 0,
                param = c(mu, delta, alpha, beta),
                tol = 10^(-5), density = TRUE, ...)
Arguments
DetailsThe particular hyperbolic distribution being considered is specified
by the value of the parameter value If If ValueA two-component vector giving the lower and upper ends of the range. Author(s)David Scott d.scott@auckland.ac.nz, Jennifer Tso, Richard Trendall ReferencesBarndorff-Nielsen, O. and Bl<c3><a6>sild, P (1983). Hyperbolic distributions. In Encyclopedia of Statistical Sciences, eds., Johnson, N. L., Kotz, S. and Read, C. B., Vol. 3, pp. 700–707. New York: Wiley. See Also
Examplespar(mfrow = c(1, 2)) param <- c(0, 1, 3, 1) hyperbRange <- hyperbCalcRange(param = param, tol = 10^(-3)) hyperbRange curve(phyperb(x, param = param), hyperbRange[1], hyperbRange[2]) maxDens <- dhyperb(hyperbMode(param = param), param = param) hyperbRange <- hyperbCalcRange(param = param, tol = 10^(-3) * maxDens, density = TRUE) hyperbRange curve(dhyperb(x, param = param), hyperbRange[1], hyperbRange[2]) Results
R version 3.3.1 (2016-06-21) -- "Bug in Your Hair"
Copyright (C) 2016 The R Foundation for Statistical Computing
Platform: x86_64-pc-linux-gnu (64-bit)

R is free software and comes with ABSOLUTELY NO WARRANTY.
You are welcome to redistribute it under certain conditions.
Type 'license()' or 'licence()' for distribution details.

R is a collaborative project with many contributors.
Type 'contributors()' for more information and
'citation()' on how to cite R or R packages in publications.

Type 'demo()' for some demos, 'help()' for on-line help, or
'help.start()' for an HTML browser interface to help.
Type 'q()' to quit R.

> library(GeneralizedHyperbolic)
Loading required package: DistributionUtils
Loading required package: RUnit
> png(filename="/home/ddbj/snapshot/RGM3/R_CC/result/GeneralizedHyperbolic/hyperbCalcRange.Rd_%03d_medium.png", width=480, height=480)
> ### Name: hyperbCalcRange
> ### Title: Range of a Hyperbolic Distribution
> ### Aliases: hyperbCalcRange
> ### Keywords: distribution
>
> ### ** Examples
>
> par(mfrow = c(1, 2))
> param <- c(0, 1, 3, 1)
> hyperbRange <- hyperbCalcRange(param = param, tol = 10^(-3))
> hyperbRange
[1] -2.123201  4.414176
> curve(phyperb(x, param = param), hyperbRange[1], hyperbRange[2])
> maxDens <- dhyperb(hyperbMode(param = param), param = param)
> hyperbRange <- hyperbCalcRange(param = param, tol = 10^(-3) * maxDens, density = TRUE)
> hyperbRange
[1] -2.276609  4.710633
> curve(dhyperb(x, param = param), hyperbRange[1], hyperbRange[2])
>
>
>
>
>
> dev.off()
null device
          1
>
|