Supported by Dr. Osamu Ogasawara and  . . |
|
Last data update: 2014.03.03 |
Parameter Sets for the Hyperbolic DistributionDescriptionThese objects store different parameter sets of the hyperbolic distribution as matrices for testing or demonstration purposes. The parameter sets For the shape parameters alpha and beta the
approach is more complex. The values for these shape parameters were
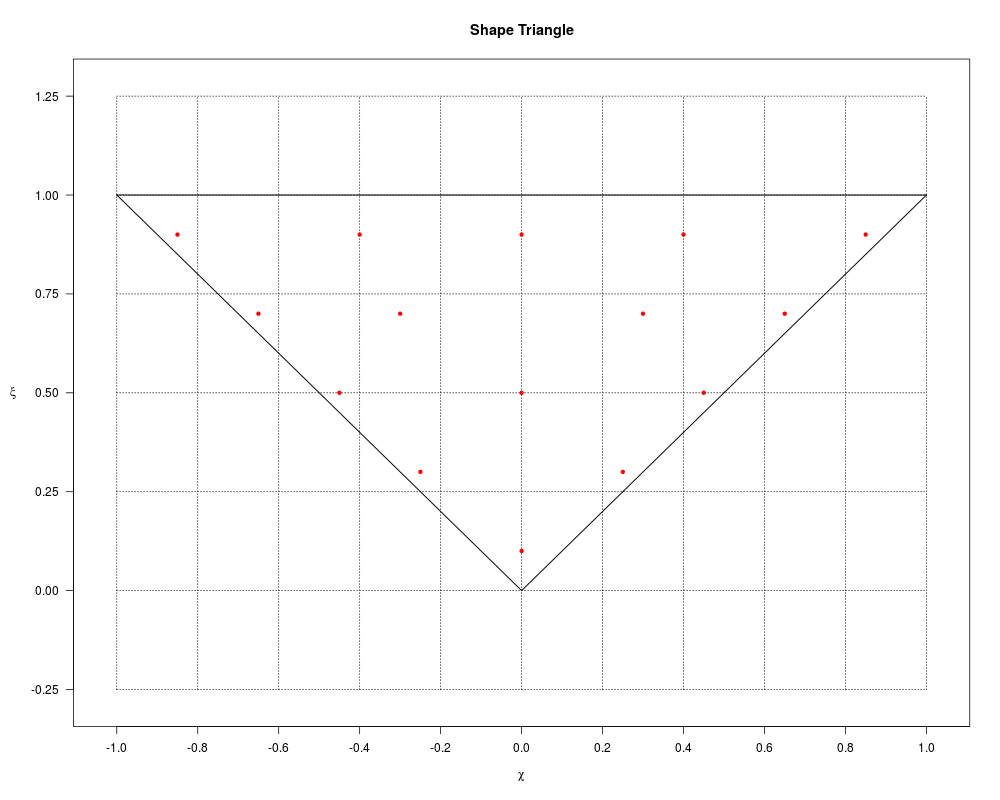
chosen by choosing values of xi and chi which
range over the shape triangle, then the function UsagehyperbSmallShape hyperbLargeShape hyperbSmallParam hyperbLargeParam Format
Author(s)David Scott d.scott@auckland.ac.nz Examples
data(hyperbParam)
plotShapeTriangle()
xis <- rep(c(0.1,0.3,0.5,0.7,0.9), 1:5)
chis <- c(0,-0.25,0.25,-0.45,0,0.45,-0.65,-0.3,0.3,0.65,
          -0.85,-0.4,0,0.4,0.85)
points(chis, xis, pch = 20, col = "red")


## Testing the accuracy of hyperbMean
for (i in 1:nrow(hyperbSmallParam)) {
  param <- hyperbSmallParam[i, ]
  x <- rhyperb(1000, param = param)
  sampleMean <- mean(x)
  funMean <- hyperbMean(param = param)
  difference <- abs(sampleMean - funMean)
  print(difference)
}
Results
R version 3.3.1 (2016-06-21) -- "Bug in Your Hair"
Copyright (C) 2016 The R Foundation for Statistical Computing
Platform: x86_64-pc-linux-gnu (64-bit)

R is free software and comes with ABSOLUTELY NO WARRANTY.
You are welcome to redistribute it under certain conditions.
Type 'license()' or 'licence()' for distribution details.

R is a collaborative project with many contributors.
Type 'contributors()' for more information and
'citation()' on how to cite R or R packages in publications.

Type 'demo()' for some demos, 'help()' for on-line help, or
'help.start()' for an HTML browser interface to help.
Type 'q()' to quit R.

> library(GeneralizedHyperbolic)
Loading required package: DistributionUtils
Loading required package: RUnit
> png(filename="/home/ddbj/snapshot/RGM3/R_CC/result/GeneralizedHyperbolic/hyperbParam.Rd_%03d_medium.png", width=480, height=480)
> ### Name: hyperbParam
> ### Title: Parameter Sets for the Hyperbolic Distribution
> ### Aliases: hyperbParam hyperbSmallShape hyperbLargeShape hyperbSmallParam
> ###   hyperbLargeParam
>
> ### ** Examples
>
> data(hyperbParam)
> plotShapeTriangle()
> xis <- rep(c(0.1,0.3,0.5,0.7,0.9), 1:5)
> chis <- c(0,-0.25,0.25,-0.45,0,0.45,-0.65,-0.3,0.3,0.65,
+           -0.85,-0.4,0,0.4,0.85)
> points(chis, xis, pch = 20, col = "red")
>
>
> ## Testing the accuracy of hyperbMean
> for (i in 1:nrow(hyperbSmallParam)) {
+   param <- hyperbSmallParam[i, ]
+   x <- rhyperb(1000, param = param)
+   sampleMean <- mean(x)
+   funMean <- hyperbMean(param = param)
+   difference <- abs(sampleMean - funMean)
+   print(difference)
+ }
[1] 0.001283463
[1] 0.02435437
[1] 0.03841906
[1] 0.1423733
[1] 0.04421782
[1] 0.09400643
[1] 0.2762678
[1] 0.0186508
[1] 0.0809459
[1] 0.08006488
[1] 1.520711
[1] 0.3815463
[1] 0.383951
[1] 0.08939263
[1] 0.005025002
[1] 0.01975047
[1] 0.01102964
[1] 0.06460246
[1] 0.02680613
[1] 0.01428168
[1] 0.02592917
[1] 0.006257403
[1] 0.03218231
[1] 0.01382794
[1] 0.5440419
[1] 0.5723738
[1] 0.4381677
[1] 0.6858696
>
>
>
>
>
>
> dev.off()
null device
          1
>
|