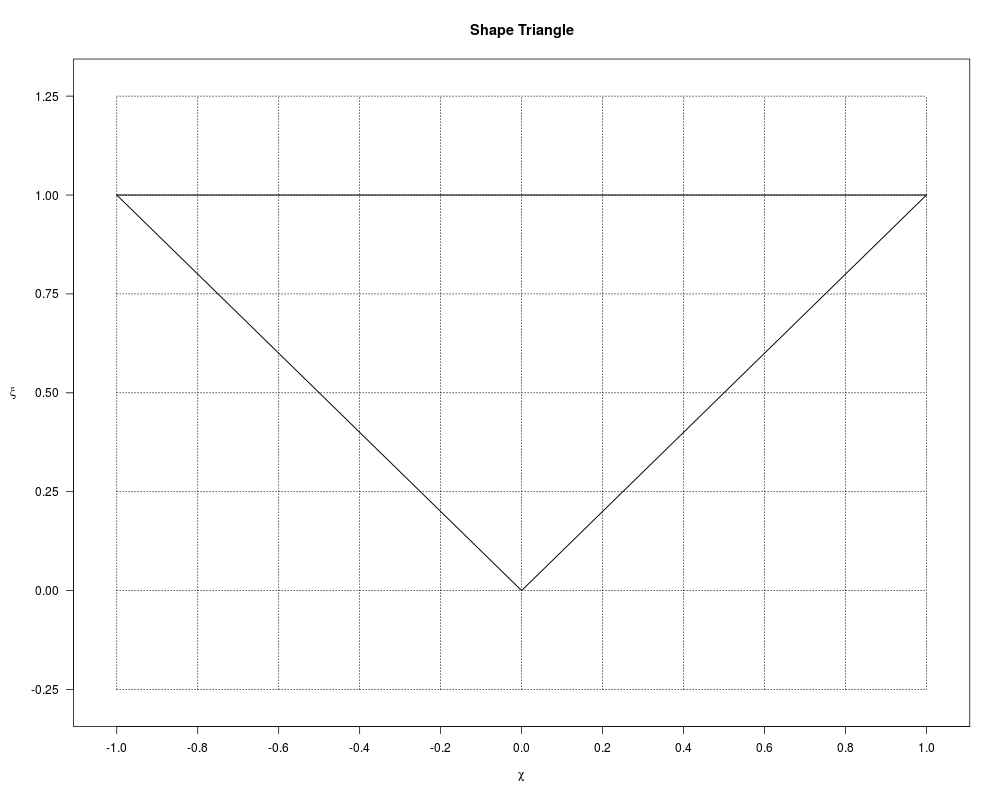
Plots the shape triangle for a hyperbolic distribution or generalized
hyperbolic distribution. For the hyperbolic distribution the parameter
chi is related to the skewness, and the parameter
xi is related to the kurtosis. See Barndorff-Nielsen, O. and
Bl<c3><a6>sild, P. (1981).
Barndorff-Nielsen, O. and Bl<c3><a6>sild, P (1981).
Hyperbolic distributions and ramifications: contributions to theory
and application.
In Statistical Distributions in Scientific Work,
eds., Taillie, C., Patil, G. P., and Baldessari, B. A., Vol. 4,
pp. 19–44. Dordrecht: Reidel.
Examples
plotShapeTriangle()
Results
R version 3.3.1 (2016-06-21) -- "Bug in Your Hair"
Copyright (C) 2016 The R Foundation for Statistical Computing
Platform: x86_64-pc-linux-gnu (64-bit)

R is free software and comes with ABSOLUTELY NO WARRANTY.
You are welcome to redistribute it under certain conditions.
Type 'license()' or 'licence()' for distribution details.

R is a collaborative project with many contributors.
Type 'contributors()' for more information and
'citation()' on how to cite R or R packages in publications.

Type 'demo()' for some demos, 'help()' for on-line help, or
'help.start()' for an HTML browser interface to help.
Type 'q()' to quit R.

> library(GeneralizedHyperbolic)
Loading required package: DistributionUtils
Loading required package: RUnit
> png(filename="/home/ddbj/snapshot/RGM3/R_CC/result/GeneralizedHyperbolic/plotShapeTriangle.Rd_%03d_medium.png", width=480, height=480)
> ### Name: plotShapeTriangle
> ### Title: Plot the Shape Triangle
> ### Aliases: plotShapeTriangle
> ### Keywords: distribution
>
> ### ** Examples
>
> plotShapeTriangle()
>
>
>
>
>
> dev.off()
null device
          1
>
 .
.