Supported by Dr. Osamu Ogasawara and  . . |
|
Last data update: 2014.03.03 |
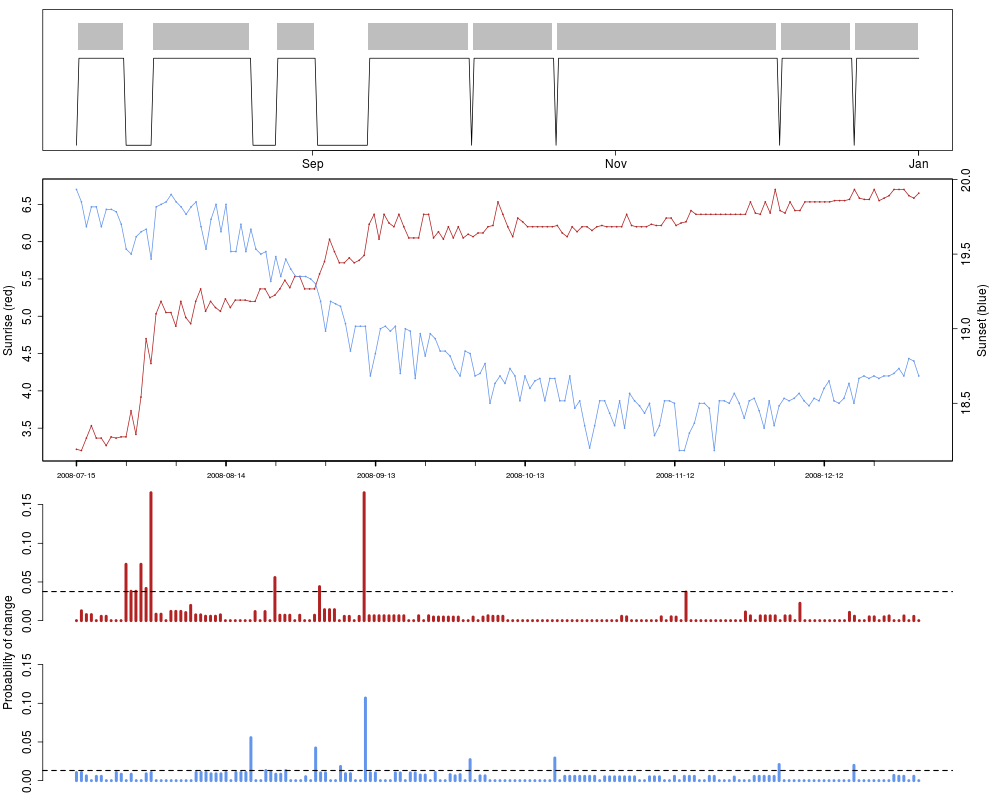
Residency analysis using a changepoint modelDescriptionFunction to discriminate between periods of residency and movement based on
consecutive sunrise and sunset data. The calculation is based on a
changepoint model (R Package UsagechangeLight(tFirst, tSecond, type, twl, quantile = 0.9, rise.prob = NA, set.prob = NA, days = 5, plot = TRUE, summary = TRUE) Arguments
DetailsThe ValueA NoteThe sunrise and/or sunset times shown in the graph (if
Author(s)Simeon Lisovski & Tamara Emmenegger ReferencesTaylor, Wayne A. (2000) Change-Point Analysis: A Powerful New Tool For Detecting Changes. M. Csorgo, L. Horvath (1997) Limit Theorems in Change-Point Analysis. Wiley. Chen, J. and Gupta, A. K. (2000) Parametric statistical change point analysis. Birkhauser. See Also
Examplesdata(hoopoe2) hoopoe2$tFirst <- as.POSIXct(hoopoe2$tFirst, tz = "GMT") hoopoe2$tSecond <- as.POSIXct(hoopoe2$tSecond, tz = "GMT") residency <- changeLight(hoopoe2, quantile=0.9) Results
R version 3.3.1 (2016-06-21) -- "Bug in Your Hair"
Copyright (C) 2016 The R Foundation for Statistical Computing
Platform: x86_64-pc-linux-gnu (64-bit)

R is free software and comes with ABSOLUTELY NO WARRANTY.
You are welcome to redistribute it under certain conditions.
Type 'license()' or 'licence()' for distribution details.

R is a collaborative project with many contributors.
Type 'contributors()' for more information and
'citation()' on how to cite R or R packages in publications.

Type 'demo()' for some demos, 'help()' for on-line help, or
'help.start()' for an HTML browser interface to help.
Type 'q()' to quit R.

> library(GeoLight)
Loading required package: maps

 # maps v3.1: updated 'world': all lakes moved to separate new #
 # 'lakes' database. Type '?world' or 'news(package="maps")'.  #


> png(filename="/home/ddbj/snapshot/RGM3/R_CC/result/GeoLight/changeLight.Rd_%03d_medium.png", width=480, height=480)
> ### Name: changeLight
> ### Title: Residency analysis using a changepoint model
> ### Aliases: changeLight
>
> ### ** Examples
>
> data(hoopoe2)
>   hoopoe2$tFirst <- as.POSIXct(hoopoe2$tFirst, tz = "GMT")
>   hoopoe2$tSecond <- as.POSIXct(hoopoe2$tSecond, tz = "GMT")
> residency <- changeLight(hoopoe2, quantile=0.9)

Probability threshold(s):

	Sunrise:  0.03757	Sunset:  0.01307


Migration schedule table:

  Site             Arrival           Departure Days     P.start       P.end
1    a 2008-07-15 23:34:00 2008-07-24 23:32:30  9.0 0.010416667 0.008333333
2    b 2008-07-31 00:15:00 2008-08-19 12:26:00 19.5 0.010500257 0.000000000
3    c 2008-08-25 00:25:30 2008-09-01 12:20:00  7.5 0.008333333 0.006995885
4    d 2008-09-12 12:27:30 2008-10-02 12:28:00 20.0 0.006321499 0.000000000
5    e 2008-10-03 12:22:30 2008-10-19 12:26:00 16.0 0.004629630 0.000000000
6    f 2008-10-20 12:22:00 2008-12-03 12:35:30 44.0 0.000000000 0.006198347
7    g 2008-12-04 12:28:30 2008-12-18 12:32:00 14.0 0.000000000 0.010706019
8    h 2008-12-19 12:41:00                <NA>   NA 0.005729167 0.000000000
  Days.1   P.start.1
1    9.0 0.010416667
2   19.5 0.010500257
3    7.5 0.008333333
4   20.0 0.006321499
5   16.0 0.004629630
6   44.0 0.000000000
7   14.0 0.000000000
8     NA 0.005729167
>
>
>
>
>
> dev.off()
null device
          1
>
|