a SpatialPoints or matrix object, containing x
and y coordinates (in that order).
site
a numerical vector assigning each row to a particular
period. Stationary periods in numerical order and values >0,
migration/movement periods 0.
type
either points, or cross to show all points for each site or only show the mean position of the site with standard deviation.
quantiles
the quantile of the error bars (cross) around the median.
hull
logical, if TRUE a convex hull will be plotted around the points of each site.
map.range
some possibilities to choose defined areas ("World
(default)", "EuroAfrica","America","AustralAsia").
...
Arguments to be passed to methods, such as graphical parameters (see par).
Details
Standard graphical paramters like pch, cex, lwd, lty and col are implemented.
The color can be specified as either a vector of colors (e.g. c("blue", "red", ...)) or as a character string indicating a color ramp (at the moment only "random" and "rainbow" is available )
R version 3.3.1 (2016-06-21) -- "Bug in Your Hair"
Copyright (C) 2016 The R Foundation for Statistical Computing
Platform: x86_64-pc-linux-gnu (64-bit)
R is free software and comes with ABSOLUTELY NO WARRANTY.
You are welcome to redistribute it under certain conditions.
Type 'license()' or 'licence()' for distribution details.
R is a collaborative project with many contributors.
Type 'contributors()' for more information and
'citation()' on how to cite R or R packages in publications.
Type 'demo()' for some demos, 'help()' for on-line help, or
'help.start()' for an HTML browser interface to help.
Type 'q()' to quit R.
> library(GeoLight)
Loading required package: maps
# maps v3.1: updated 'world': all lakes moved to separate new #
# 'lakes' database. Type '?world' or 'news(package="maps")'. #
> png(filename="/home/ddbj/snapshot/RGM3/R_CC/result/GeoLight/siteMap.Rd_%03d_medium.png", width=480, height=480)
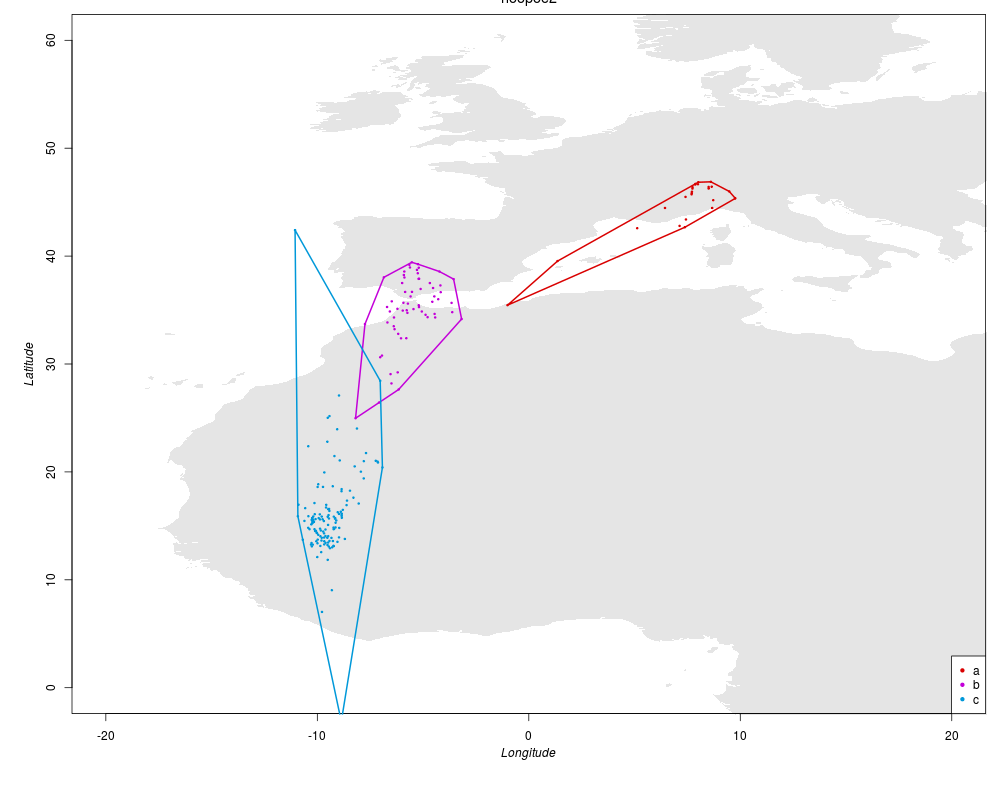
> ### Name: siteMap
> ### Title: Draws sites of residency and adds a convex hull
> ### Aliases: siteMap
>
> ### ** Examples
>
> data(hoopoe2)
> hoopoe2$tFirst <- as.POSIXct(hoopoe2$tFirst, tz = "GMT")
> hoopoe2$tSecond <- as.POSIXct(hoopoe2$tSecond, tz = "GMT")
> crds <- coord(hoopoe2, degElevation = -6)
Note: Out of 340 twilight pairs, the calculation of 22 latitudes failed (6 %)> filter <- distanceFilter(hoopoe2, distance = 30)
Note: 92 of 318 positions were filtered (28 %)> site <- changeLight(hoopoe2, rise.prob = 0.1, set.prob = 0.1, plot = FALSE,
+ summary = FALSE)$site
> siteMap(crds[filter,], site[filter], xlim=c(-20,20), ylim=c(0,60),
+ lwd=2, pch=20, cex=0.5, main="hoopoe2")
>
>
>
>
>
> dev.off()
null device
1
>
 .
.