Supported by Dr. Osamu Ogasawara and  . . |
|
Last data update: 2014.03.03 |
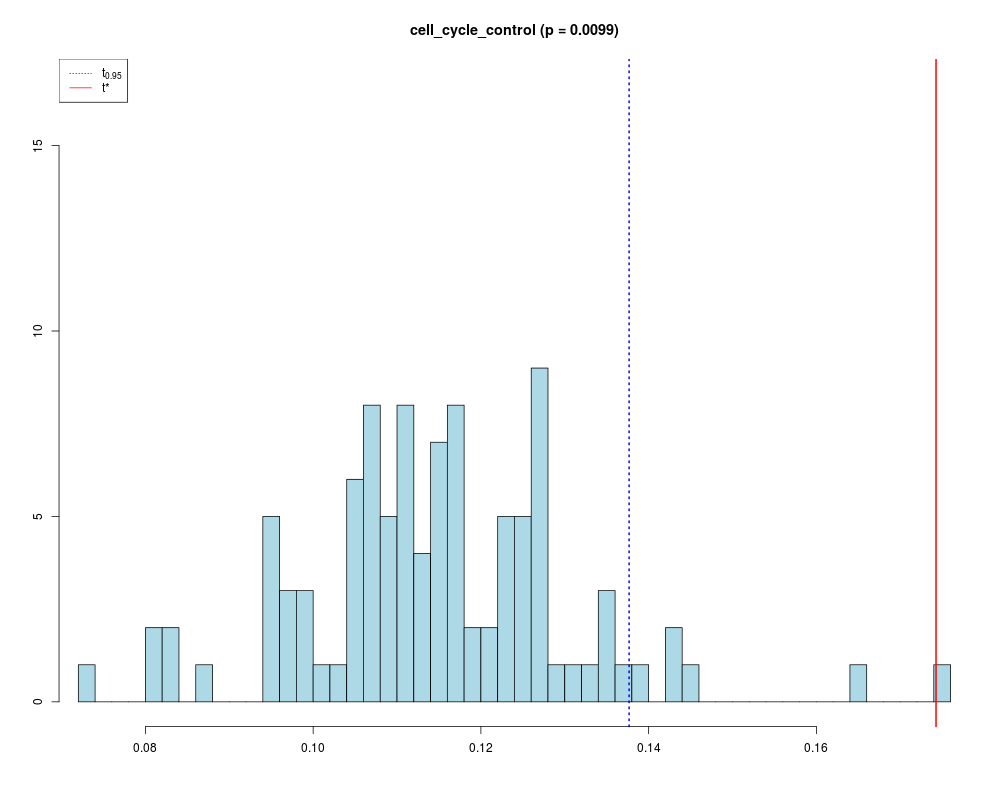
Null distribution histogram and statistic of the input set for enrichment analyses.DescriptionPlots the distribution of gene set statistic values obtained in different resampling settings of an enrichment analysis, and draws the statistic value of the input set as a vertical line. Usage## S3 method for class 'gsaResult' hist(x, signLevel = x$signLevel, subset = NULL, ask = FALSE, addLegend = TRUE, ...) Arguments
DetailsThe function plots the distribution of gene set statistic values under the null hypothesis. It requires the
significance assessment step of the enrichment analysis configuration (parameter A histogram is plotted for the analysis in The statistic value of the input set is depicted as a vertical line. The most common graphical parameters can be supplied as vectors (one entry per analyzed gene set) to vary them between the different analyses. These parameters are: See Also
Examples# load data require(GlobalAncova) data(vantVeer) data(phenodata) data(pathways) res <- geneSetAnalysis( # global parameters dat = vantVeer, geneSets = pathways[3], analysis = analysis.averageCorrelation(), # additional parameters for analysis.averageCorrelation labs = phenodata$metastases, p = 1, numSamples = 100) # plot the histogram for the cell cycle control gene set hist(res, main = names(pathways[3])) Results
R version 3.3.1 (2016-06-21) -- "Bug in Your Hair"
Copyright (C) 2016 The R Foundation for Statistical Computing
Platform: x86_64-pc-linux-gnu (64-bit)

R is free software and comes with ABSOLUTELY NO WARRANTY.
You are welcome to redistribute it under certain conditions.
Type 'license()' or 'licence()' for distribution details.

R is a collaborative project with many contributors.
Type 'contributors()' for more information and
'citation()' on how to cite R or R packages in publications.

Type 'demo()' for some demos, 'help()' for on-line help, or
'help.start()' for an HTML browser interface to help.
Type 'q()' to quit R.

> library(GiANT)
> png(filename="/home/ddbj/snapshot/RGM3/R_CC/result/GiANT/hist.Rd_%03d_medium.png", width=480, height=480)
> ### Name: hist
> ### Title: Null distribution histogram and statistic of the input set for
> ###   enrichment analyses.
> ### Aliases: hist.gsaResult
>
> ### ** Examples
>
> # load data
> require(GlobalAncova)
Loading required package: GlobalAncova
Loading required package: corpcor
Loading required package: globaltest
Loading required package: survival
> data(vantVeer)
> data(phenodata)
> data(pathways)
>
> res <- geneSetAnalysis(
+ 	# global parameters
+ 	dat = vantVeer,
+ 	geneSets = pathways[3],
+ 	analysis = analysis.averageCorrelation(),
+ 	# additional parameters for analysis.averageCorrelation
+ 	labs = phenodata$metastases,
+ 	p = 1,
+ 	numSamples = 100)
>
> # plot the histogram for the cell cycle control gene set
> hist(res, main = names(pathways[3]))
>
>
>
>
>
> dev.off()
null device
          1
>
|