A result of a call to geneSetAnalysis using the predefined analysis analysis.customOverrepresentation or analysis.overrepresentation.
signLevel
Only results with significance level smaller than the given value are included in the venn diagram.
subset
Indices for the results that should be included in the diagram.
aggregate
Specifies whether all gene sets should be plotted in a single Venn diagram (which is possible for at most four gene sets) or whether there should be one Venn diagram for each gene set.
ask
If set to true, the plot function will prompt for a user input for each new plot that is shown on an interactive device (see par("ask")). If aggregate = TRUE, ask is ignored.
...
Further parameters to be passed to vennDiagram.
See Also
geneSetAnalysis, predefinedAnalyses, gsAnalysis
Examples
# load data
require(GlobalAncova)
data(vantVeer)
data(phenodata)
data(pathways)
# use the absolute correlation as a gene-level statistic
stat <- abs(apply(vantVeer,1,cor,y = phenodata$metastases))
# define the core set as the 25% genes with the highest correlation
coreSet <- rownames(vantVeer)[tail(order(stat), 25)]
# perform an overrepresentation analysis
resOverrep <- geneSetAnalysis(
dat = vantVeer,
geneSets = pathways,
analysis = analysis.customOverrepresentation(),
coreSet = coreSet,
adjustmentMethod = "fdr")
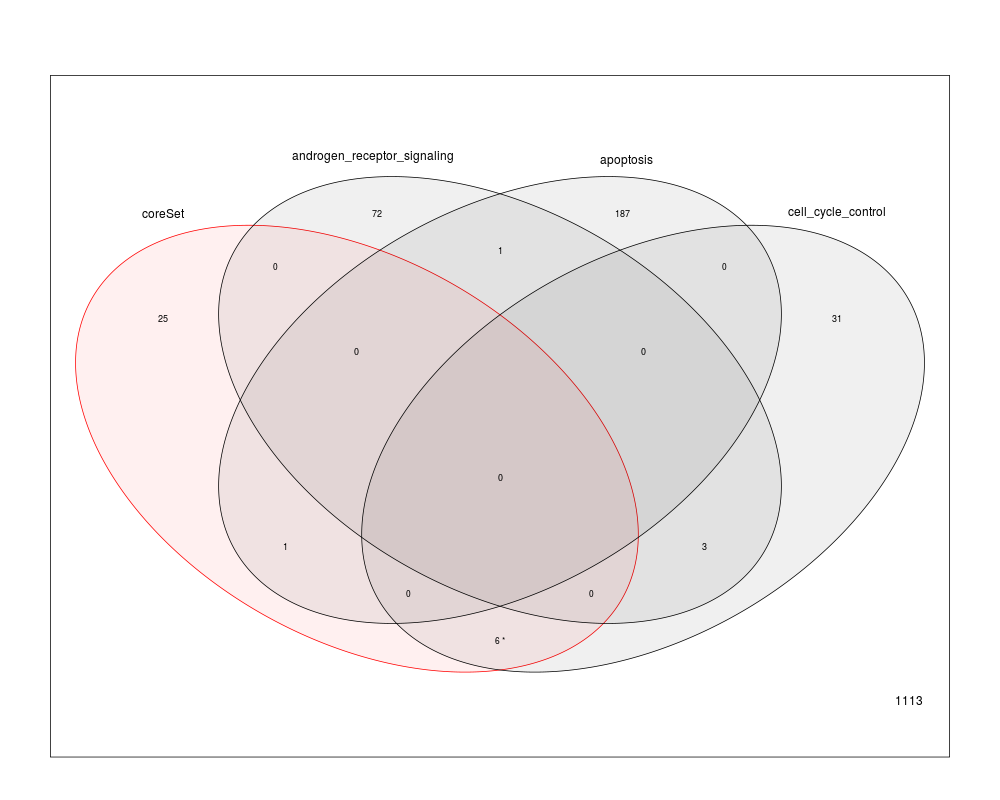
# plot a Venn diagram
plotOverrepresentation(resOverrep, subset = 1:3, aggregate = TRUE)
Results
R version 3.3.1 (2016-06-21) -- "Bug in Your Hair"
Copyright (C) 2016 The R Foundation for Statistical Computing
Platform: x86_64-pc-linux-gnu (64-bit)

R is free software and comes with ABSOLUTELY NO WARRANTY.
You are welcome to redistribute it under certain conditions.
Type 'license()' or 'licence()' for distribution details.

R is a collaborative project with many contributors.
Type 'contributors()' for more information and
'citation()' on how to cite R or R packages in publications.

Type 'demo()' for some demos, 'help()' for on-line help, or
'help.start()' for an HTML browser interface to help.
Type 'q()' to quit R.

> library(GiANT)
> png(filename="/home/ddbj/snapshot/RGM3/R_CC/result/GiANT/plotOverrepresentation.Rd_%03d_medium.png", width=480, height=480)
> ### Name: plotOverrepresentation
> ### Title: Plot overlap of gene sets and core set
> ### Aliases: plotOverrepresentation
>
> ### ** Examples
>
> # load data
> require(GlobalAncova)
Loading required package: GlobalAncova
Loading required package: corpcor
Loading required package: globaltest
Loading required package: survival
> data(vantVeer)
> data(phenodata)
> data(pathways)
>
> # use the absolute correlation as a gene-level statistic
> stat <- abs(apply(vantVeer,1,cor,y = phenodata$metastases))
> # define the core set as the 25% genes with the highest correlation
> coreSet <- rownames(vantVeer)[tail(order(stat), 25)]
>
> # perform an overrepresentation analysis
> resOverrep <- geneSetAnalysis(
+ 	dat = vantVeer,
+ 	geneSets = pathways,
+ 	analysis = analysis.customOverrepresentation(),
+ 	coreSet = coreSet,
+ 	adjustmentMethod = "fdr")
>
> # plot a Venn diagram
> plotOverrepresentation(resOverrep, subset = 1:3, aggregate = TRUE)
Loading required namespace: limma
>
>
>
>
>
> dev.off()
null device
          1
>
 .
.