Supported by Dr. Osamu Ogasawara and  . . |
|
Last data update: 2014.03.03 |
Ordinary (empirical) RSV (Raffinetti, Siletti and Vernizzi, 2015) curve of maximum inequality for negative attributesDescriptioncomputes the x-axis and y-axis values of the ordinary (empirical) RSV curve of maximum inequality for negative attributes. UsageRSVc(z,w=rep(1,length(z)),plot=FALSE) Arguments
Details
ValueA list of class
NoteIf the vector Author(s)Emanuela Raffinetti, Fabio Aimar ReferencesE. Raffinetti, E. Siletti, A. Vernizzi (2014), Inequality measures and the issue of negative income. Italian Statistical Society Conference (SIS), Book of Short Papers: "SIS 2014. 47th Scientific Meeting of the Italian Statistical Society", CUEC (Cooperativa Universitaria Editrice Cagliaritana), 11-13 June 2014
See Also
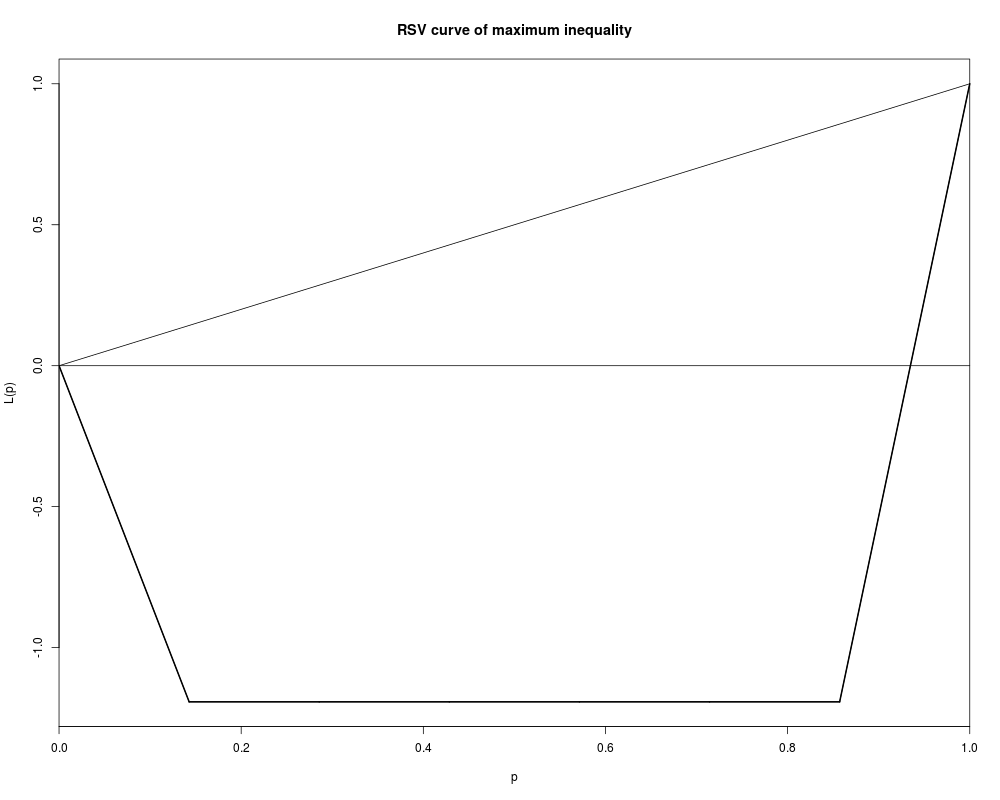
Examples# generate the vector of attributes with even negative elements z<-c(-8,-11,9,-12,7,6,35) # plot the ordinary (empirical) RSV curve of maximum inequality RSVc(z,plot=TRUE) # generate the vector of attributes with even negative elements z<-c(12,-21,-10,6,1,-3,40) # generate the vector of non-unitary weights w<-c(1.2,2.3,1.6,3.5,4.7,4,2.2) # plot the ordinary (empirical) RSV curve of maximum inequality RSVc(z,w,plot=TRUE) data(BI2012) # define the vector of non-unitary weights w<-BI2012$weight # select the vector of incomes (e.g., the incomes from transfers YTA) z<-BI2012$YTA # plot the ordinary (empirical) RSV curve of maximum inequality RSVc(z,w,plot=TRUE) # select the vector of incomes (e.g., the incomes from financial capital gain YCF) z<-BI2012$YCF # plot the ordinary (empirical) RSV curve of maximum inequality RSVc(z,w,plot=TRUE) Results
R version 3.3.1 (2016-06-21) -- "Bug in Your Hair"
Copyright (C) 2016 The R Foundation for Statistical Computing
Platform: x86_64-pc-linux-gnu (64-bit)
R is free software and comes with ABSOLUTELY NO WARRANTY.
You are welcome to redistribute it under certain conditions.
Type 'license()' or 'licence()' for distribution details.
R is a collaborative project with many contributors.
Type 'contributors()' for more information and
'citation()' on how to cite R or R packages in publications.
Type 'demo()' for some demos, 'help()' for on-line help, or
'help.start()' for an HTML browser interface to help.
Type 'q()' to quit R.
> library(GiniWegNeg)
> png(filename="/home/ddbj/snapshot/RGM3/R_CC/result/GiniWegNeg/RSVc.Rd_%03d_medium.png", width=480, height=480)
> ### Name: RSVc
> ### Title: Ordinary (empirical) RSV (Raffinetti, Siletti and Vernizzi,
> ### 2015) curve of maximum inequality for negative attributes
> ### Aliases: RSVc
>
> ### ** Examples
>
> # generate the vector of attributes with even negative elements
> z<-c(-8,-11,9,-12,7,6,35)
> # plot the ordinary (empirical) RSV curve of maximum inequality
> RSVc(z,plot=TRUE)
$`RSV (maximum inequality) x-axis points`
[1] 0.0000000 0.1428571 0.2857143 0.4285714 0.5714286 0.7142857 0.8571429
[8] 1.0000000
$`RSV (maximum inequality) y-axis points`
[1] 0.000000 -1.192308 -1.192308 -1.192308 -1.192308 -1.192308 -1.192308
[8] 1.000000
>
> # generate the vector of attributes with even negative elements
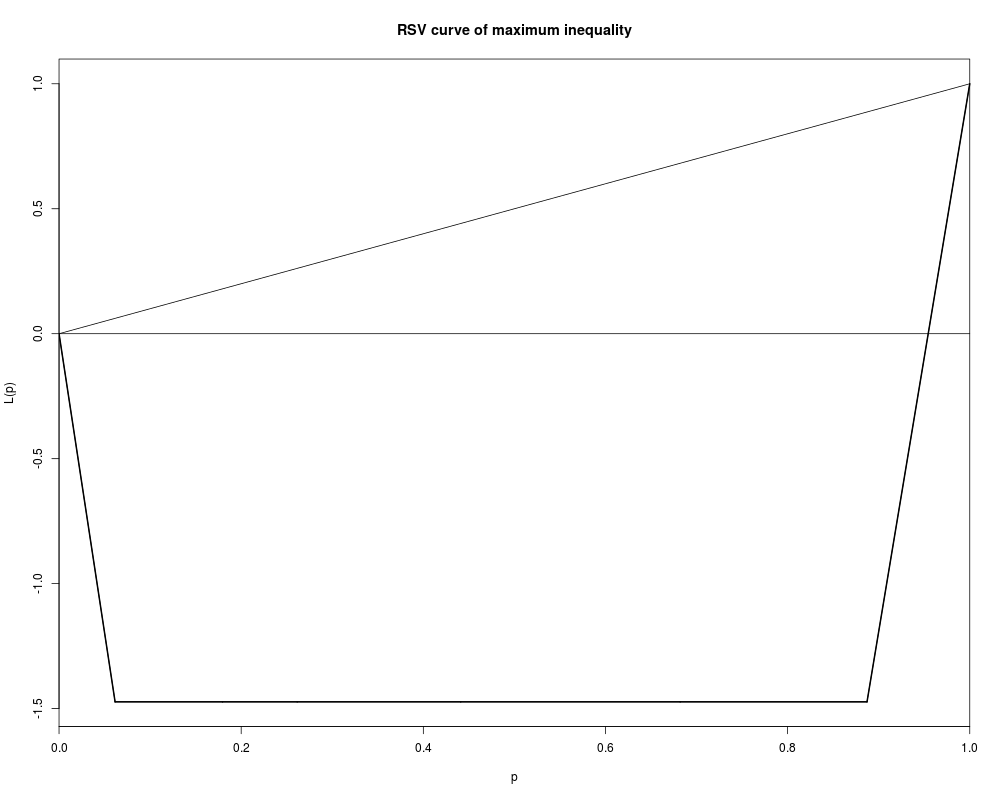
> z<-c(12,-21,-10,6,1,-3,40)
> # generate the vector of non-unitary weights
> w<-c(1.2,2.3,1.6,3.5,4.7,4,2.2)
> # plot the ordinary (empirical) RSV curve of maximum inequality
> RSVc(z,w,plot=TRUE)
$`RSV (maximum inequality) x-axis points`
[1] 0.00000000 0.06153846 0.17948718 0.26153846 0.44102564 0.68205128 0.88717949
[8] 1.00000000
$`RSV (maximum inequality) y-axis points`
[1] 0.000000 -1.472973 -1.472973 -1.472973 -1.472973 -1.472973 -1.472973
[8] 1.000000
>
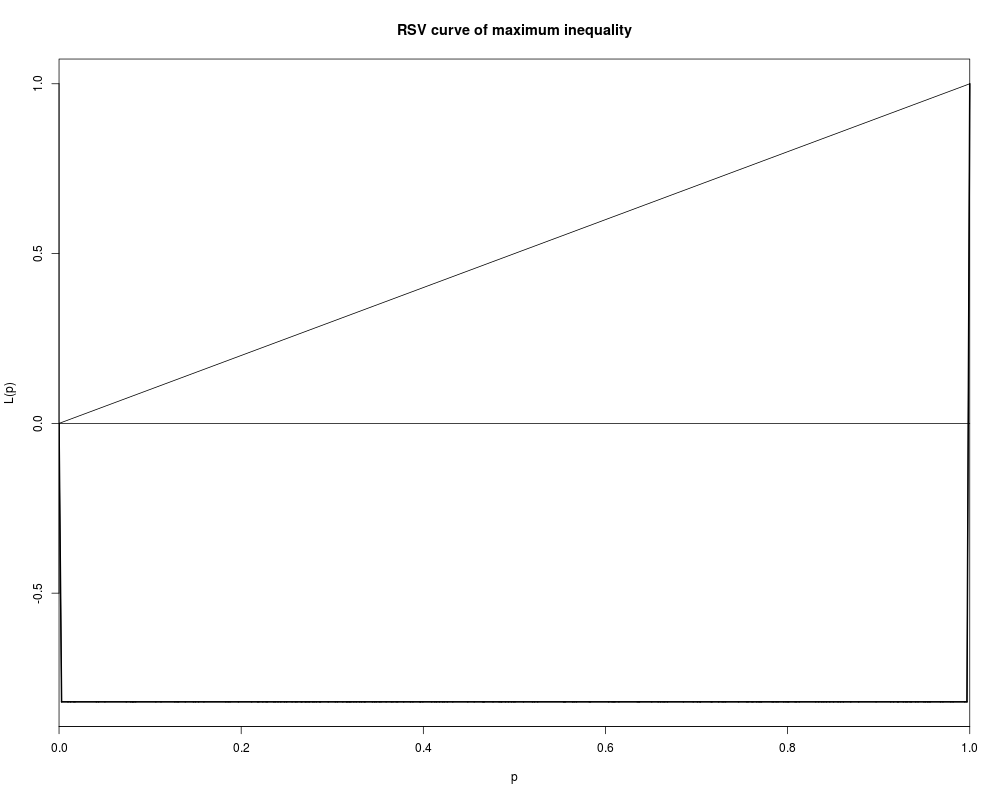
> data(BI2012)
> # define the vector of non-unitary weights
> w<-BI2012$weight
>
> # select the vector of incomes (e.g., the incomes from transfers YTA)
> z<-BI2012$YTA
> # plot the ordinary (empirical) RSV curve of maximum inequality
> RSVc(z,w,plot=TRUE)
$`RSV (maximum inequality) x-axis points`
[1] 0.000000000 0.002793724 0.009800403 0.012653261 0.016247102 0.017533666
[7] 0.040996217 0.043388341 0.050347197 0.073820033 0.078678326 0.080427168
[13] 0.081154780 0.082176523 0.084134136 0.106256646 0.111961335 0.127178981
[19] 0.129607614 0.131203219 0.138652122 0.147510485 0.149741659 0.153199747
[25] 0.159073613 0.183109513 0.185721720 0.187714813 0.196980433 0.211448355
[31] 0.218071945 0.219338454 0.223744752 0.227368418 0.228701774 0.235806154
[37] 0.237370907 0.240447963 0.243474111 0.247477781 0.249852935 0.255902661
[43] 0.259575177 0.261253057 0.265895380 0.266720693 0.270309392 0.271289484
[49] 0.273396732 0.275024219 0.278589264 0.280143219 0.282488034 0.286017084
[55] 0.286969408 0.295621057 0.303374374 0.305671368 0.311587913 0.316100654
[61] 0.316100654 0.318329772 0.319200850 0.320487413 0.323697650 0.326336596
[67] 0.329958205 0.332165725 0.335123998 0.336136485 0.344075947 0.346393509
[73] 0.348256506 0.351659574 0.353505602 0.359149614 0.364942233 0.366657651
[79] 0.370253034 0.371816245 0.378410009 0.385897992 0.388570362 0.396310310
[85] 0.396889829 0.399482495 0.409130691 0.412543014 0.414444063 0.417674869
[91] 0.421182322 0.423012409 0.426342458 0.432337678 0.448784810 0.455867078
[97] 0.465190804 0.466604378 0.466604378 0.476536420 0.483224286 0.485210180
[103] 0.485975844 0.490212967 0.493444801 0.496822158 0.499284728 0.500719899
[109] 0.509965980 0.519862026 0.522042807 0.525557459 0.553927154 0.554862509
[115] 0.556076569 0.563872051 0.565610608 0.568039241 0.582204805 0.583508337
[121] 0.603507659 0.607302557 0.609040600 0.610338476 0.614733462 0.634891161
[127] 0.636447173 0.637362473 0.650772658 0.657871381 0.660466618 0.663222291
[133] 0.665093001 0.667994196 0.685583396 0.696343322 0.700978960 0.703960373
[139] 0.703960373 0.716038229 0.716998780 0.724230170 0.728124826 0.729893208
[145] 0.731831794 0.746142882 0.755165279 0.756576282 0.760768153 0.761960615
[151] 0.766072270 0.768489589 0.769765868 0.771253489 0.783015103 0.784527921
[157] 0.787405976 0.789497798 0.795729042 0.798204468 0.800148196 0.801181766
[163] 0.808200272 0.809546998 0.812797858 0.830851908 0.834075515 0.837523834
[169] 0.839772491 0.842578556 0.846267013 0.850413634 0.855391738 0.858111930
[175] 0.861207498 0.869333620 0.877994525 0.897109398 0.913158528 0.916363109
[181] 0.920651139 0.921647685 0.927029962 0.929730614 0.931267599 0.934481950
[187] 0.935897581 0.940582070 0.943219473 0.949608066 0.951285946 0.953675498
[193] 0.955271104 0.956542241 0.967934135 0.970536572 0.979177422 0.981700670
[199] 0.994517966 0.996942998 1.000000000
$`RSV (maximum inequality) y-axis points`
[1] 0.0000000 -0.8199687 -0.8199687 -0.8199687 -0.8199687 -0.8199687
[7] -0.8199687 -0.8199687 -0.8199687 -0.8199687 -0.8199687 -0.8199687
[13] -0.8199687 -0.8199687 -0.8199687 -0.8199687 -0.8199687 -0.8199687
[19] -0.8199687 -0.8199687 -0.8199687 -0.8199687 -0.8199687 -0.8199687
[25] -0.8199687 -0.8199687 -0.8199687 -0.8199687 -0.8199687 -0.8199687
[31] -0.8199687 -0.8199687 -0.8199687 -0.8199687 -0.8199687 -0.8199687
[37] -0.8199687 -0.8199687 -0.8199687 -0.8199687 -0.8199687 -0.8199687
[43] -0.8199687 -0.8199687 -0.8199687 -0.8199687 -0.8199687 -0.8199687
[49] -0.8199687 -0.8199687 -0.8199687 -0.8199687 -0.8199687 -0.8199687
[55] -0.8199687 -0.8199687 -0.8199687 -0.8199687 -0.8199687 -0.8199687
[61] -0.8199687 -0.8199687 -0.8199687 -0.8199687 -0.8199687 -0.8199687
[67] -0.8199687 -0.8199687 -0.8199687 -0.8199687 -0.8199687 -0.8199687
[73] -0.8199687 -0.8199687 -0.8199687 -0.8199687 -0.8199687 -0.8199687
[79] -0.8199687 -0.8199687 -0.8199687 -0.8199687 -0.8199687 -0.8199687
[85] -0.8199687 -0.8199687 -0.8199687 -0.8199687 -0.8199687 -0.8199687
[91] -0.8199687 -0.8199687 -0.8199687 -0.8199687 -0.8199687 -0.8199687
[97] -0.8199687 -0.8199687 -0.8199687 -0.8199687 -0.8199687 -0.8199687
[103] -0.8199687 -0.8199687 -0.8199687 -0.8199687 -0.8199687 -0.8199687
[109] -0.8199687 -0.8199687 -0.8199687 -0.8199687 -0.8199687 -0.8199687
[115] -0.8199687 -0.8199687 -0.8199687 -0.8199687 -0.8199687 -0.8199687
[121] -0.8199687 -0.8199687 -0.8199687 -0.8199687 -0.8199687 -0.8199687
[127] -0.8199687 -0.8199687 -0.8199687 -0.8199687 -0.8199687 -0.8199687
[133] -0.8199687 -0.8199687 -0.8199687 -0.8199687 -0.8199687 -0.8199687
[139] -0.8199687 -0.8199687 -0.8199687 -0.8199687 -0.8199687 -0.8199687
[145] -0.8199687 -0.8199687 -0.8199687 -0.8199687 -0.8199687 -0.8199687
[151] -0.8199687 -0.8199687 -0.8199687 -0.8199687 -0.8199687 -0.8199687
[157] -0.8199687 -0.8199687 -0.8199687 -0.8199687 -0.8199687 -0.8199687
[163] -0.8199687 -0.8199687 -0.8199687 -0.8199687 -0.8199687 -0.8199687
[169] -0.8199687 -0.8199687 -0.8199687 -0.8199687 -0.8199687 -0.8199687
[175] -0.8199687 -0.8199687 -0.8199687 -0.8199687 -0.8199687 -0.8199687
[181] -0.8199687 -0.8199687 -0.8199687 -0.8199687 -0.8199687 -0.8199687
[187] -0.8199687 -0.8199687 -0.8199687 -0.8199687 -0.8199687 -0.8199687
[193] -0.8199687 -0.8199687 -0.8199687 -0.8199687 -0.8199687 -0.8199687
[199] -0.8199687 -0.8199687 1.0000000
>
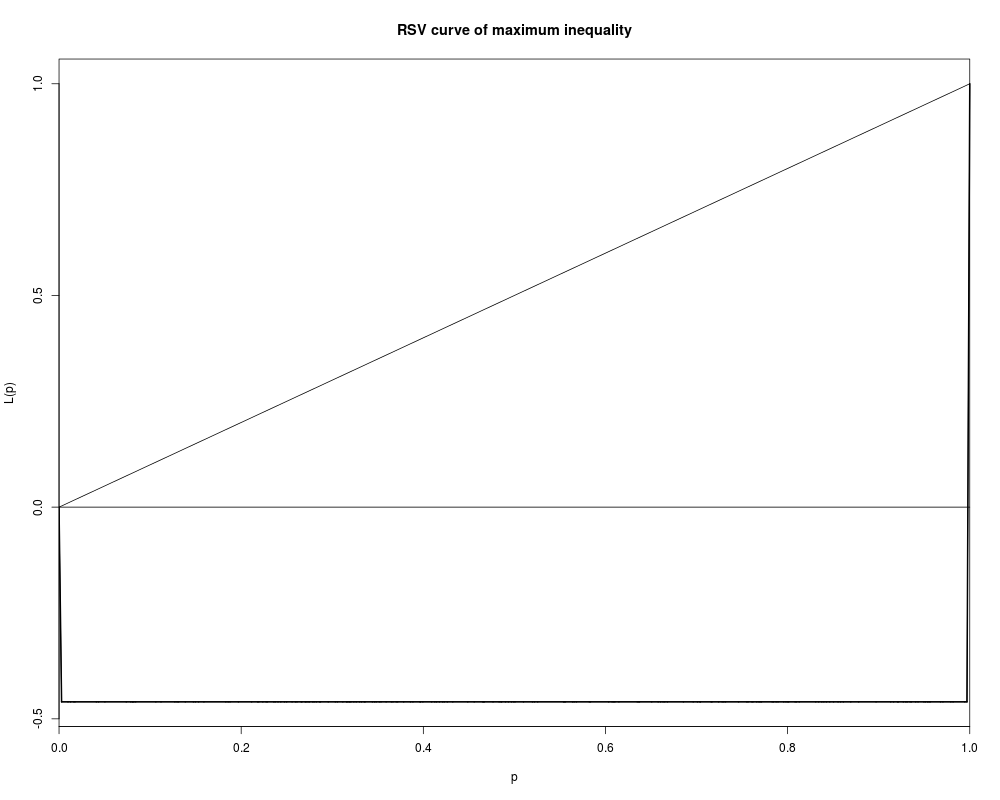
> # select the vector of incomes (e.g., the incomes from financial capital gain YCF)
> z<-BI2012$YCF
> # plot the ordinary (empirical) RSV curve of maximum inequality
> RSVc(z,w,plot=TRUE)
$`RSV (maximum inequality) x-axis points`
[1] 0.000000000 0.002793724 0.009800403 0.012653261 0.016247102 0.017533666
[7] 0.040996217 0.043388341 0.050347197 0.073820033 0.078678326 0.080427168
[13] 0.081154780 0.082176523 0.084134136 0.106256646 0.111961335 0.127178981
[19] 0.129607614 0.131203219 0.138652122 0.147510485 0.149741659 0.153199747
[25] 0.159073613 0.183109513 0.185721720 0.187714813 0.196980433 0.211448355
[31] 0.218071945 0.219338454 0.223744752 0.227368418 0.228701774 0.235806154
[37] 0.237370907 0.240447963 0.243474111 0.247477781 0.249852935 0.255902661
[43] 0.259575177 0.261253057 0.265895380 0.266720693 0.270309392 0.271289484
[49] 0.273396732 0.275024219 0.278589264 0.280143219 0.282488034 0.286017084
[55] 0.286969408 0.295621057 0.303374374 0.305671368 0.311587913 0.316100654
[61] 0.316100654 0.318329772 0.319200850 0.320487413 0.323697650 0.326336596
[67] 0.329958205 0.332165725 0.335123998 0.336136485 0.344075947 0.346393509
[73] 0.348256506 0.351659574 0.353505602 0.359149614 0.364942233 0.366657651
[79] 0.370253034 0.371816245 0.378410009 0.385897992 0.388570362 0.396310310
[85] 0.396889829 0.399482495 0.409130691 0.412543014 0.414444063 0.417674869
[91] 0.421182322 0.423012409 0.426342458 0.432337678 0.448784810 0.455867078
[97] 0.465190804 0.466604378 0.466604378 0.476536420 0.483224286 0.485210180
[103] 0.485975844 0.490212967 0.493444801 0.496822158 0.499284728 0.500719899
[109] 0.509965980 0.519862026 0.522042807 0.525557459 0.553927154 0.554862509
[115] 0.556076569 0.563872051 0.565610608 0.568039241 0.582204805 0.583508337
[121] 0.603507659 0.607302557 0.609040600 0.610338476 0.614733462 0.634891161
[127] 0.636447173 0.637362473 0.650772658 0.657871381 0.660466618 0.663222291
[133] 0.665093001 0.667994196 0.685583396 0.696343322 0.700978960 0.703960373
[139] 0.703960373 0.716038229 0.716998780 0.724230170 0.728124826 0.729893208
[145] 0.731831794 0.746142882 0.755165279 0.756576282 0.760768153 0.761960615
[151] 0.766072270 0.768489589 0.769765868 0.771253489 0.783015103 0.784527921
[157] 0.787405976 0.789497798 0.795729042 0.798204468 0.800148196 0.801181766
[163] 0.808200272 0.809546998 0.812797858 0.830851908 0.834075515 0.837523834
[169] 0.839772491 0.842578556 0.846267013 0.850413634 0.855391738 0.858111930
[175] 0.861207498 0.869333620 0.877994525 0.897109398 0.913158528 0.916363109
[181] 0.920651139 0.921647685 0.927029962 0.929730614 0.931267599 0.934481950
[187] 0.935897581 0.940582070 0.943219473 0.949608066 0.951285946 0.953675498
[193] 0.955271104 0.956542241 0.967934135 0.970536572 0.979177422 0.981700670
[199] 0.994517966 0.996942998 1.000000000
$`RSV (maximum inequality) y-axis points`
[1] 0.0000000 -0.4598762 -0.4598762 -0.4598762 -0.4598762 -0.4598762
[7] -0.4598762 -0.4598762 -0.4598762 -0.4598762 -0.4598762 -0.4598762
[13] -0.4598762 -0.4598762 -0.4598762 -0.4598762 -0.4598762 -0.4598762
[19] -0.4598762 -0.4598762 -0.4598762 -0.4598762 -0.4598762 -0.4598762
[25] -0.4598762 -0.4598762 -0.4598762 -0.4598762 -0.4598762 -0.4598762
[31] -0.4598762 -0.4598762 -0.4598762 -0.4598762 -0.4598762 -0.4598762
[37] -0.4598762 -0.4598762 -0.4598762 -0.4598762 -0.4598762 -0.4598762
[43] -0.4598762 -0.4598762 -0.4598762 -0.4598762 -0.4598762 -0.4598762
[49] -0.4598762 -0.4598762 -0.4598762 -0.4598762 -0.4598762 -0.4598762
[55] -0.4598762 -0.4598762 -0.4598762 -0.4598762 -0.4598762 -0.4598762
[61] -0.4598762 -0.4598762 -0.4598762 -0.4598762 -0.4598762 -0.4598762
[67] -0.4598762 -0.4598762 -0.4598762 -0.4598762 -0.4598762 -0.4598762
[73] -0.4598762 -0.4598762 -0.4598762 -0.4598762 -0.4598762 -0.4598762
[79] -0.4598762 -0.4598762 -0.4598762 -0.4598762 -0.4598762 -0.4598762
[85] -0.4598762 -0.4598762 -0.4598762 -0.4598762 -0.4598762 -0.4598762
[91] -0.4598762 -0.4598762 -0.4598762 -0.4598762 -0.4598762 -0.4598762
[97] -0.4598762 -0.4598762 -0.4598762 -0.4598762 -0.4598762 -0.4598762
[103] -0.4598762 -0.4598762 -0.4598762 -0.4598762 -0.4598762 -0.4598762
[109] -0.4598762 -0.4598762 -0.4598762 -0.4598762 -0.4598762 -0.4598762
[115] -0.4598762 -0.4598762 -0.4598762 -0.4598762 -0.4598762 -0.4598762
[121] -0.4598762 -0.4598762 -0.4598762 -0.4598762 -0.4598762 -0.4598762
[127] -0.4598762 -0.4598762 -0.4598762 -0.4598762 -0.4598762 -0.4598762
[133] -0.4598762 -0.4598762 -0.4598762 -0.4598762 -0.4598762 -0.4598762
[139] -0.4598762 -0.4598762 -0.4598762 -0.4598762 -0.4598762 -0.4598762
[145] -0.4598762 -0.4598762 -0.4598762 -0.4598762 -0.4598762 -0.4598762
[151] -0.4598762 -0.4598762 -0.4598762 -0.4598762 -0.4598762 -0.4598762
[157] -0.4598762 -0.4598762 -0.4598762 -0.4598762 -0.4598762 -0.4598762
[163] -0.4598762 -0.4598762 -0.4598762 -0.4598762 -0.4598762 -0.4598762
[169] -0.4598762 -0.4598762 -0.4598762 -0.4598762 -0.4598762 -0.4598762
[175] -0.4598762 -0.4598762 -0.4598762 -0.4598762 -0.4598762 -0.4598762
[181] -0.4598762 -0.4598762 -0.4598762 -0.4598762 -0.4598762 -0.4598762
[187] -0.4598762 -0.4598762 -0.4598762 -0.4598762 -0.4598762 -0.4598762
[193] -0.4598762 -0.4598762 -0.4598762 -0.4598762 -0.4598762 -0.4598762
[199] -0.4598762 -0.4598762 1.0000000
>
>
>
>
>
> dev.off()
null device
1
>
|