Supported by Dr. Osamu Ogasawara and  . . |
|
Last data update: 2014.03.03 |
High level lattice function producing population pyramids.DescriptionThis is the function used inside ‘pyramidlattice’ to produce stacked, horizontal barcharts for grouped data with varying x-scale limits to allow for distinction of i.e. male/female data points in population pyramid graphs. This is essentially a modification of ‘barchart2’ in package heR.Misc (see References). For details, see ?barchart2 (heR.Misc) and ?xyplot (lattice). Author(s)Erich Striessnig, adapted from the ‘barchart2’ function included in Neil Klepeis' heR.Misc package. ReferencesheR.Misc package source: http://www.exposurescience.org/heR.doc/library/heR.Misc/html/barchart2.html Examples
data(EduDat)
data(dictionary)
# select the desired year, country, and education-scenario from EduDat
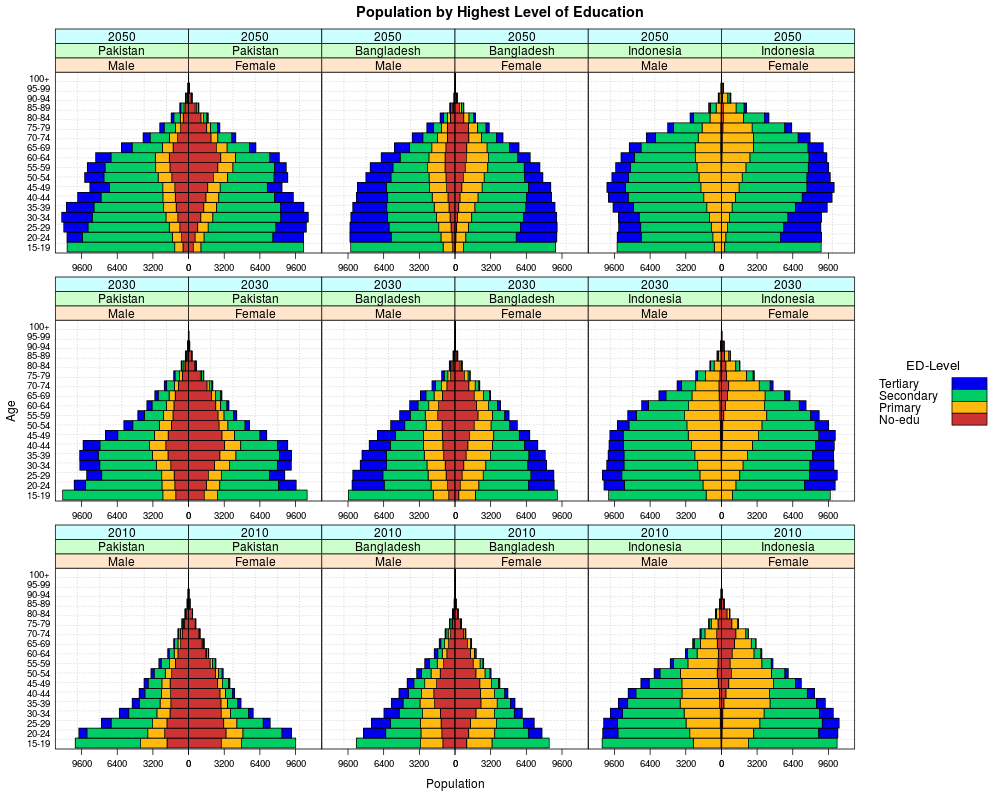
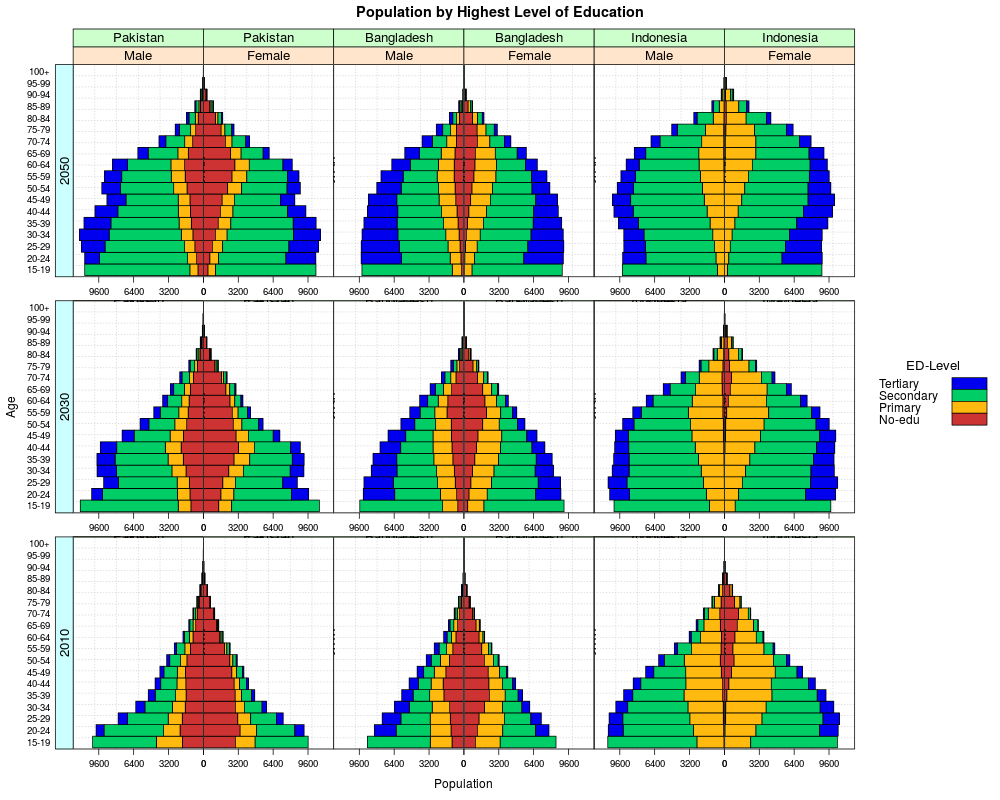
Years <- c(2010,2030,2050)
Countries <- c("Pakistan","Bangladesh","Indonesia")
Scenarios <- c("GET")
# the male-column needs to be flipped
iEduDat <- subset(EduDat,match(cc,getcode(Countries,dictionary)) & match(yr,Years) & match(scen2,Scenarios))
iEduDat$value[iEduDat$sex == "Male"] <- (-1) * iEduDat$value[iEduDat$sex == "Male"]
agegrs <- paste(seq(15,100,5),seq(19,104,5),sep="-")
agegrs[length(agegrs)] <- "100+"
lattice.options(axis.padding = list(numeric=0))
x <- pyramidlattice(agegr ~ value| factor(sex,levels=c("Male","Female")) *
factor(cc,levels=getcode(Countries,dictionary),labels=Countries) *
factor(yr,levels=Years,labels=Years),
groups=variable,data=iEduDat,layout=c(length(Countries)*2,length(Years)),
type="l",lwd=1,xlab="Population",ylab="Age",main="Population by Highest Level of Education",
strip=TRUE,par.settings = simpleTheme(lwd=3,col=colors()[c(35,76,613,28)]),box.width=1,
scales=list(alternating=3,tick.number=5,relation="same",y=list(at=1:length(4:21),labels=agegrs)),
auto.key=list(text=c("No-edu","Primary","Secondary","Tertiary"),reverse.row=TRUE,
points=FALSE,rectangles=TRUE,space="right",columns=1,border=FALSE,
title="ED-Level",cex.title=1.1,lines.title=2.5,padding.text=1,background="white"),
prepanel=prepanel.default.bwplot2,panel=function(...){
panel.grid(h=length(agegrs),v=5,col="lightgrey",lty=3)
panel.pyramid(...)
})
x # with strips for every factor over each panel
# useOuterStrips(x) # with outer strips, but only in case of two factors
useOuterStrips2(x) # with outer strips in case of three factors
# compare different education-scenarios rather than countries
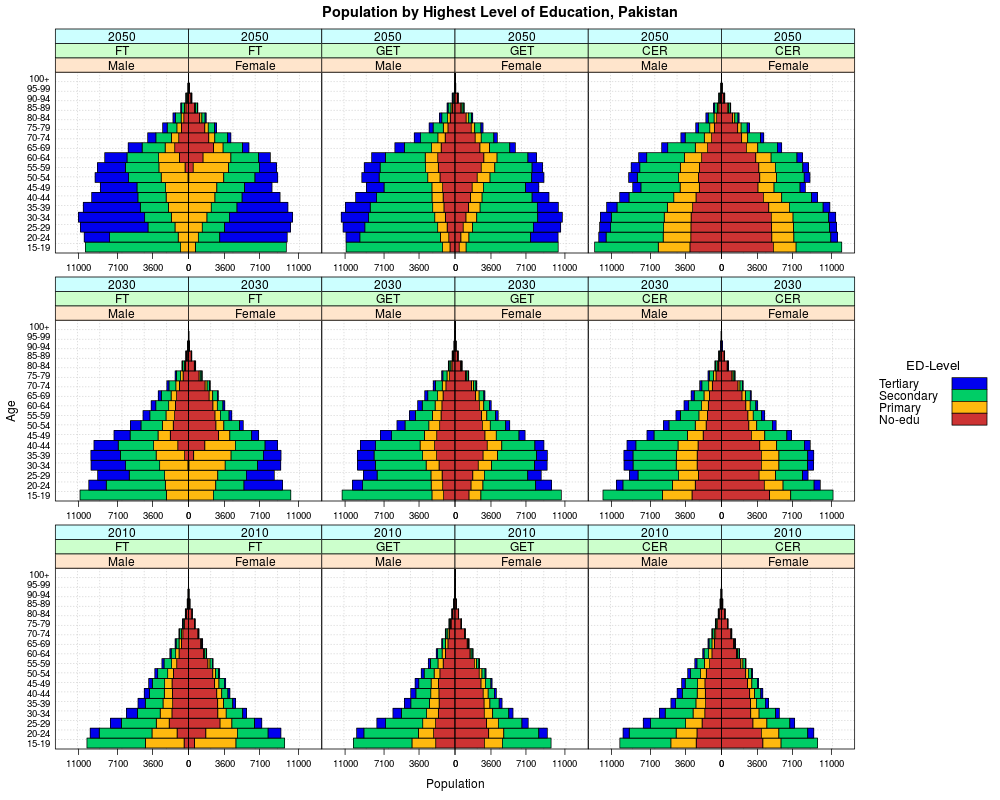
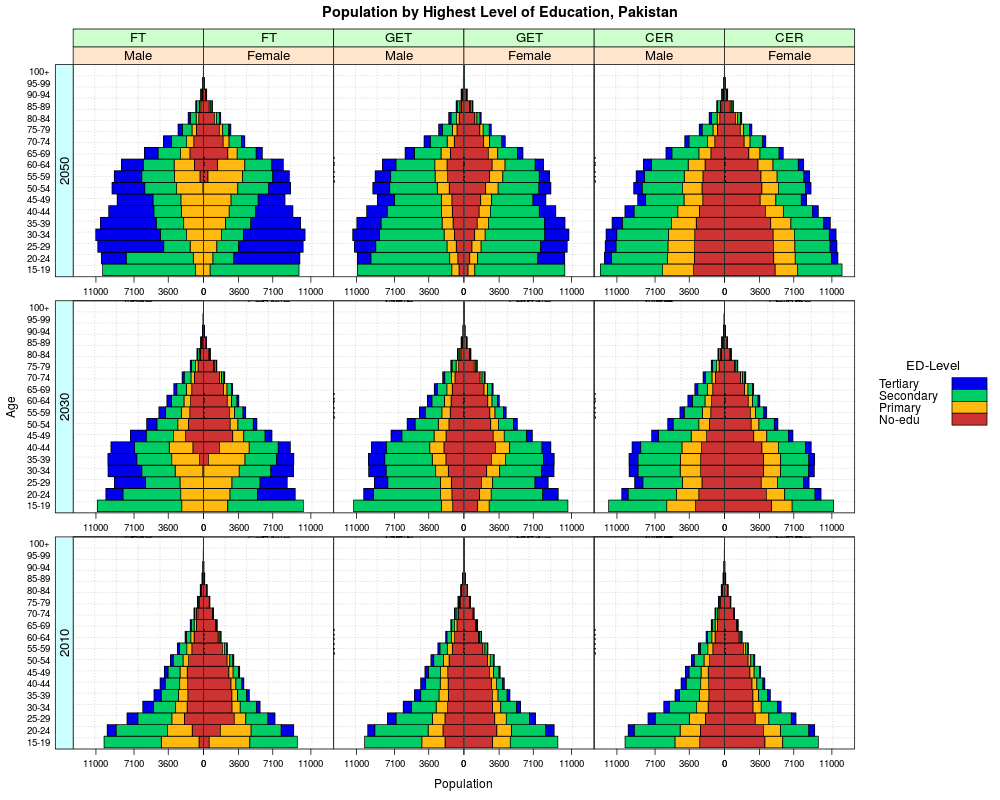
Countries <- c("Pakistan")
Scenarios <- c("FT","GET","CER")
# the male-column needs to be flipped
iEduDat <- subset(EduDat,match(cc,getcode(Countries,dictionary)) & match(yr,Years) & match(scen2,Scenarios))
iEduDat$value[iEduDat$sex == "Male"] <- (-1) * iEduDat$value[iEduDat$sex == "Male"]
lattice.options(axis.padding = list(numeric=0))
x <- pyramidlattice(agegr ~ value| factor(sex,levels=c("Male","Female")) *
factor(scen2,levels=Scenarios,labels=Scenarios) *
factor(yr,levels=Years,labels=Years),
groups=variable,data=iEduDat,layout=c(length(Scenarios)*2,length(Years)),
type="l",lwd=1,xlab="Population",ylab="Age",main=paste("Population by Highest Level of Education, ",Countries,sep=""),
strip=TRUE,par.settings = simpleTheme(lwd=3,col=colors()[c(35,76,613,28)]),box.width=1,
scales=list(alternating=3,tick.number=5,relation="same",y=list(at=1:length(4:21),labels=agegrs)),
auto.key=list(text=c("No-edu","Primary","Secondary","Tertiary"),reverse.row=TRUE,
points=FALSE,rectangles=TRUE,space="right",columns=1,border=FALSE,
title="ED-Level",cex.title=1.1,lines.title=2.5,padding.text=1,background="white"),
prepanel=prepanel.default.bwplot2,panel=function(...){
panel.grid(h=length(agegrs),v=5,col="lightgrey",lty=3)
panel.pyramid(...)
})
x # with strips for every factor over each panel
# useOuterStrips(x) # with outer strips, but only in case of two factors
useOuterStrips2(x) # with outer strips in case of three factors
Results
R version 3.3.1 (2016-06-21) -- "Bug in Your Hair"
Copyright (C) 2016 The R Foundation for Statistical Computing
Platform: x86_64-pc-linux-gnu (64-bit)

R is free software and comes with ABSOLUTELY NO WARRANTY.
You are welcome to redistribute it under certain conditions.
Type 'license()' or 'licence()' for distribution details.

R is a collaborative project with many contributors.
Type 'contributors()' for more information and
'citation()' on how to cite R or R packages in publications.

Type 'demo()' for some demos, 'help()' for on-line help, or
'help.start()' for an HTML browser interface to help.
Type 'q()' to quit R.

> library(Giza)
Loading required package: reshape
Loading required package: lattice
> png(filename="/home/ddbj/snapshot/RGM3/R_CC/result/Giza/pyramid2.Rd_%03d_medium.png", width=480, height=480)
> ### Name: pyramid2
> ### Title: High level lattice function producing population pyramids.
> ### Aliases: pyramid2
>
> ### ** Examples
>
>
> data(EduDat)
> data(dictionary)
> # select the desired year, country, and education-scenario from EduDat
> Years <- c(2010,2030,2050)
> Countries <- c("Pakistan","Bangladesh","Indonesia")
> Scenarios <- c("GET")
> # the male-column needs to be flipped
> iEduDat <- subset(EduDat,match(cc,getcode(Countries,dictionary)) & match(yr,Years) & match(scen2,Scenarios))
> iEduDat$value[iEduDat$sex == "Male"] <- (-1) * iEduDat$value[iEduDat$sex == "Male"]
>
> agegrs <- paste(seq(15,100,5),seq(19,104,5),sep="-")
> agegrs[length(agegrs)] <- "100+"
>
> lattice.options(axis.padding = list(numeric=0))
> x <- pyramidlattice(agegr ~ value| factor(sex,levels=c("Male","Female")) *
+                                    factor(cc,levels=getcode(Countries,dictionary),labels=Countries) *
+                                    factor(yr,levels=Years,labels=Years),
+            groups=variable,data=iEduDat,layout=c(length(Countries)*2,length(Years)),
+            type="l",lwd=1,xlab="Population",ylab="Age",main="Population by Highest Level of Education",
+            strip=TRUE,par.settings = simpleTheme(lwd=3,col=colors()[c(35,76,613,28)]),box.width=1,
+            scales=list(alternating=3,tick.number=5,relation="same",y=list(at=1:length(4:21),labels=agegrs)),
+            auto.key=list(text=c("No-edu","Primary","Secondary","Tertiary"),reverse.row=TRUE,
+                            points=FALSE,rectangles=TRUE,space="right",columns=1,border=FALSE,
+                            title="ED-Level",cex.title=1.1,lines.title=2.5,padding.text=1,background="white"),
+            prepanel=prepanel.default.bwplot2,panel=function(...){
+                     panel.grid(h=length(agegrs),v=5,col="lightgrey",lty=3)
+                     panel.pyramid(...)
+                    })
>
> x # with strips for every factor over each panel
> # useOuterStrips(x) # with outer strips, but only in case of two factors
> useOuterStrips2(x) # with outer strips in case of three factors
>
> # compare different education-scenarios rather than countries
> Countries <- c("Pakistan")
> Scenarios <- c("FT","GET","CER")
> # the male-column needs to be flipped
> iEduDat <- subset(EduDat,match(cc,getcode(Countries,dictionary)) & match(yr,Years) & match(scen2,Scenarios))
> iEduDat$value[iEduDat$sex == "Male"] <- (-1) * iEduDat$value[iEduDat$sex == "Male"]
>
> lattice.options(axis.padding = list(numeric=0))
> x <- pyramidlattice(agegr ~ value| factor(sex,levels=c("Male","Female")) *
+                                    factor(scen2,levels=Scenarios,labels=Scenarios) *
+                                    factor(yr,levels=Years,labels=Years),
+            groups=variable,data=iEduDat,layout=c(length(Scenarios)*2,length(Years)),
+            type="l",lwd=1,xlab="Population",ylab="Age",main=paste("Population by Highest Level of Education, ",Countries,sep=""),
+            strip=TRUE,par.settings = simpleTheme(lwd=3,col=colors()[c(35,76,613,28)]),box.width=1,
+            scales=list(alternating=3,tick.number=5,relation="same",y=list(at=1:length(4:21),labels=agegrs)),
+            auto.key=list(text=c("No-edu","Primary","Secondary","Tertiary"),reverse.row=TRUE,
+                            points=FALSE,rectangles=TRUE,space="right",columns=1,border=FALSE,
+                            title="ED-Level",cex.title=1.1,lines.title=2.5,padding.text=1,background="white"),
+            prepanel=prepanel.default.bwplot2,panel=function(...){
+                     panel.grid(h=length(agegrs),v=5,col="lightgrey",lty=3)
+                     panel.pyramid(...)
+                    })
>
> x # with strips for every factor over each panel
> # useOuterStrips(x) # with outer strips, but only in case of two factors
> useOuterStrips2(x) # with outer strips in case of three factors
>
>
>
>
>
> dev.off()
null device
          1
>
|
Created & Maintained by Osamu Ogasawara (osamu.ogasawara@gmail.com) and 