Supported by Dr. Osamu Ogasawara and  . . |
|
Last data update: 2014.03.03 |
High level lattice function used inside ‘pyramidlattice’ to produce population pyramidsDescriptionProduce stacked, horizontal barcharts for grouped data with varying x-scale limits to allow for distinction of i.e. male/female data points in population pyramid graphs. This is essentially a modification of the barchart2 function in Neil Klepeis' package heR.Misc (see References). DetailsSee the examples below and the help file for ?xyplot in the lattice-package for further details. Author(s)Erich Striessnig, adapted from the ‘barchart2’ function in Neil Klepeis' heR.Misc package. ReferencesheR.Misc package source: http://exposurescience.org/?q=hosted-projects/human-exposure-research-software-package http://www.exposurescience.org/heR.doc/library/heR.Misc/html/barchart2.html Examples
data(EduDat)
data(dictionary)
# select the desired year, country, and education-scenario from EduDat
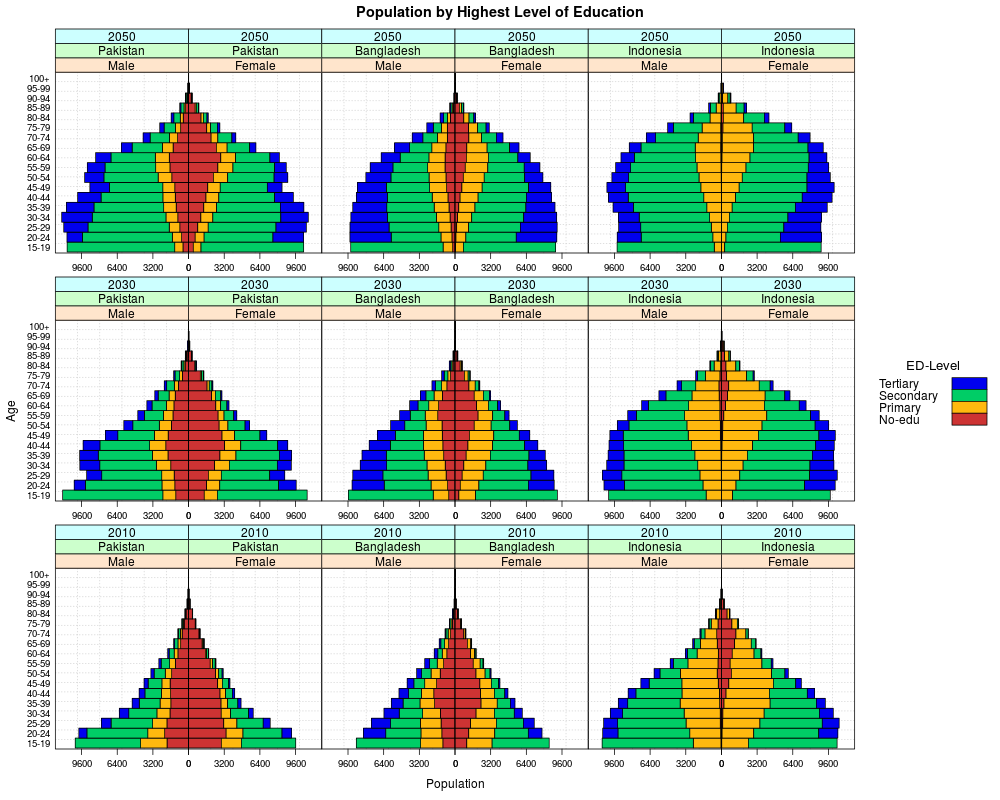
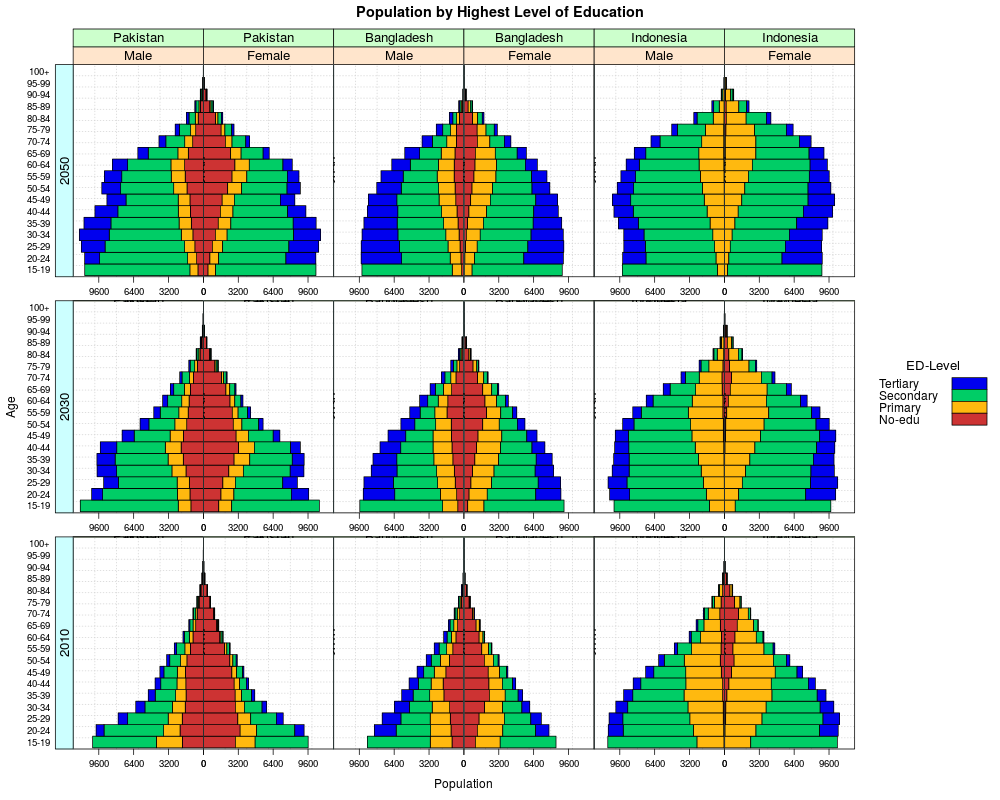
Years <- c(2010,2030,2050)
Countries <- c("Pakistan","Bangladesh","Indonesia")
Scenarios <- c("GET")
# the male-column needs to be flipped
iEduDat <- subset(EduDat,match(cc,getcode(Countries,dictionary)) & match(yr,Years) & match(scen2,Scenarios))
iEduDat$value[iEduDat$sex == "Male"] <- (-1) * iEduDat$value[iEduDat$sex == "Male"]
agegrs <- paste(seq(15,100,5),seq(19,104,5),sep="-")
agegrs[length(agegrs)] <- "100+"
lattice.options(axis.padding = list(numeric=0))
x <- pyramidlattice(agegr ~ value| factor(sex,levels=c("Male","Female")) *
factor(cc,levels=getcode(Countries,dictionary),labels=Countries) *
factor(yr,levels=Years,labels=Years),
groups=variable,data=iEduDat,layout=c(length(Countries)*2,length(Years)),
type="l",lwd=1,xlab="Population",ylab="Age",main="Population by Highest Level of Education",
strip=TRUE,par.settings = simpleTheme(lwd=3,col=colors()[c(35,76,613,28)]),box.width=1,
scales=list(alternating=3,tick.number=5,relation="same",y=list(at=1:length(4:21),labels=agegrs)),
auto.key=list(text=c("No-edu","Primary","Secondary","Tertiary"),reverse.row=TRUE,
points=FALSE,rectangles=TRUE,space="right",columns=1,border=FALSE,
title="ED-Level",cex.title=1.1,lines.title=2.5,padding.text=1,background="white"),
prepanel=prepanel.default.bwplot2,panel=function(...){
panel.grid(h=length(agegrs),v=5,col="lightgrey",lty=3)
panel.pyramid(...)
})
x # with strips for every factor over each panel
# useOuterStrips(x) # with outer strips, but only in case of two factors
useOuterStrips2(x) # with outer strips in case of three factors
# compare different education-scenarios rather than countries
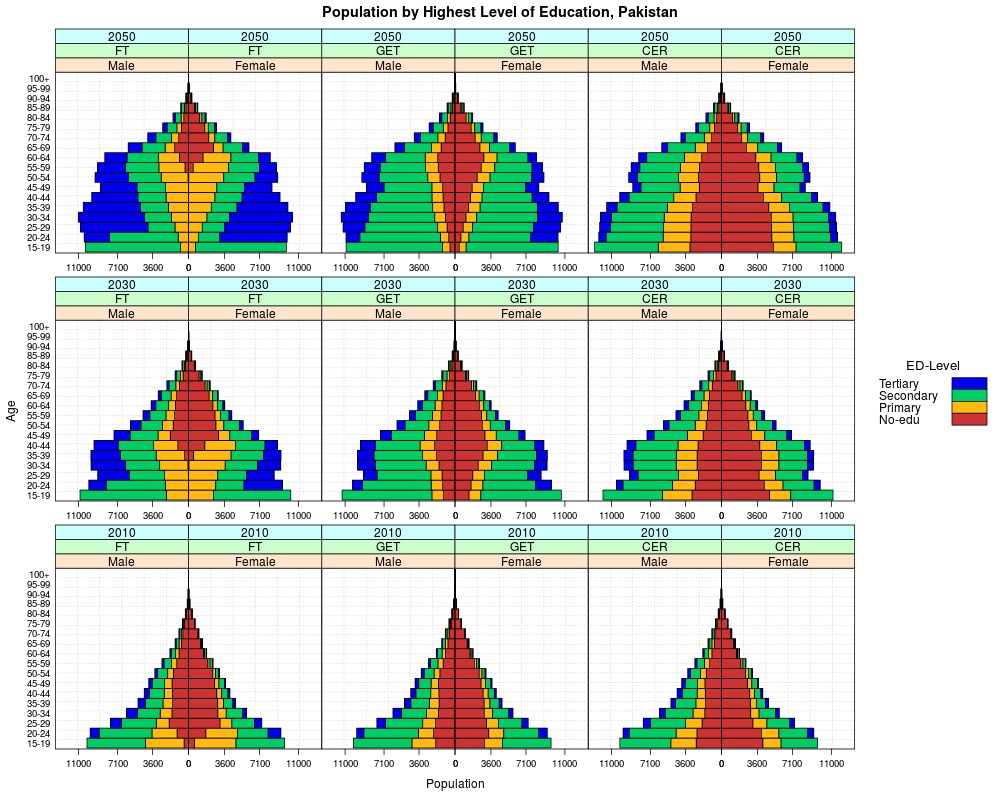
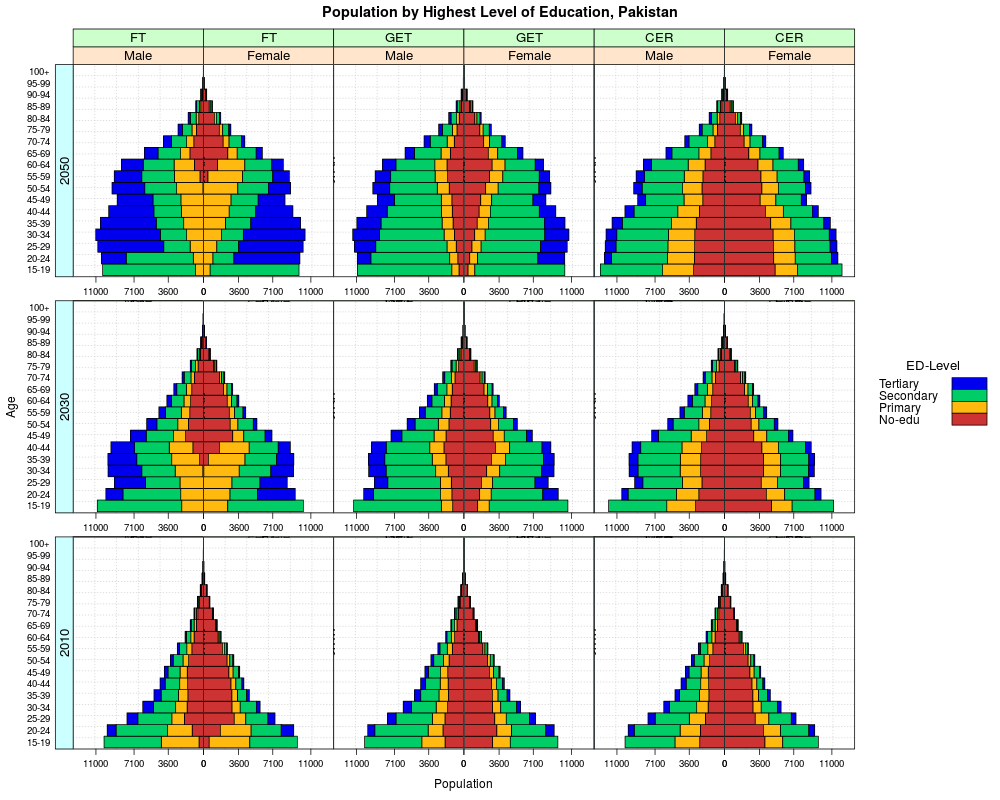
Countries <- c("Pakistan")
Scenarios <- c("FT","GET","CER")
# the male-column needs to be flipped
iEduDat <- subset(EduDat,match(cc,getcode(Countries,dictionary)) & match(yr,Years) & match(scen2,Scenarios))
iEduDat$value[iEduDat$sex == "Male"] <- (-1) * iEduDat$value[iEduDat$sex == "Male"]
lattice.options(axis.padding = list(numeric=0))
x <- pyramidlattice(agegr ~ value| factor(sex,levels=c("Male","Female")) *
factor(scen2,levels=Scenarios,labels=Scenarios) *
factor(yr,levels=Years,labels=Years),
groups=variable,data=iEduDat,layout=c(length(Scenarios)*2,length(Years)),
type="l",lwd=1,xlab="Population",ylab="Age",main=paste("Population by Highest Level of Education, ",Countries,sep=""),
strip=TRUE,par.settings = simpleTheme(lwd=3,col=colors()[c(35,76,613,28)]),box.width=1,
scales=list(alternating=3,tick.number=5,relation="same",y=list(at=1:length(4:21),labels=agegrs)),
auto.key=list(text=c("No-edu","Primary","Secondary","Tertiary"),reverse.row=TRUE,
points=FALSE,rectangles=TRUE,space="right",columns=1,border=FALSE,
title="ED-Level",cex.title=1.1,lines.title=2.5,padding.text=1,background="white"),
prepanel=prepanel.default.bwplot2,panel=function(...){
panel.grid(h=length(agegrs),v=5,col="lightgrey",lty=3)
panel.pyramid(...)
})
x # with strips for every factor over each panel
# useOuterStrips(x) # with outer strips, but only in case of two factors
useOuterStrips2(x) # with outer strips in case of three factors
Results
R version 3.3.1 (2016-06-21) -- "Bug in Your Hair"
Copyright (C) 2016 The R Foundation for Statistical Computing
Platform: x86_64-pc-linux-gnu (64-bit)

R is free software and comes with ABSOLUTELY NO WARRANTY.
You are welcome to redistribute it under certain conditions.
Type 'license()' or 'licence()' for distribution details.

R is a collaborative project with many contributors.
Type 'contributors()' for more information and
'citation()' on how to cite R or R packages in publications.

Type 'demo()' for some demos, 'help()' for on-line help, or
'help.start()' for an HTML browser interface to help.
Type 'q()' to quit R.

> library(Giza)
Loading required package: reshape
Loading required package: lattice
> png(filename="/home/ddbj/snapshot/RGM3/R_CC/result/Giza/pyramid2.formula.Rd_%03d_medium.png", width=480, height=480)
> ### Name: pyramid2.formula
> ### Title: High level lattice function used inside 'pyramidlattice' to
> ###   produce population pyramids
> ### Aliases: pyramid2.formula
>
> ### ** Examples
>
>
> data(EduDat)
> data(dictionary)
> # select the desired year, country, and education-scenario from EduDat
> Years <- c(2010,2030,2050)
> Countries <- c("Pakistan","Bangladesh","Indonesia")
> Scenarios <- c("GET")
> # the male-column needs to be flipped
> iEduDat <- subset(EduDat,match(cc,getcode(Countries,dictionary)) & match(yr,Years) & match(scen2,Scenarios))
> iEduDat$value[iEduDat$sex == "Male"] <- (-1) * iEduDat$value[iEduDat$sex == "Male"]
>
> agegrs <- paste(seq(15,100,5),seq(19,104,5),sep="-")
> agegrs[length(agegrs)] <- "100+"
>
> lattice.options(axis.padding = list(numeric=0))
> x <- pyramidlattice(agegr ~ value| factor(sex,levels=c("Male","Female")) *
+                                    factor(cc,levels=getcode(Countries,dictionary),labels=Countries) *
+                                    factor(yr,levels=Years,labels=Years),
+            groups=variable,data=iEduDat,layout=c(length(Countries)*2,length(Years)),
+            type="l",lwd=1,xlab="Population",ylab="Age",main="Population by Highest Level of Education",
+            strip=TRUE,par.settings = simpleTheme(lwd=3,col=colors()[c(35,76,613,28)]),box.width=1,
+            scales=list(alternating=3,tick.number=5,relation="same",y=list(at=1:length(4:21),labels=agegrs)),
+            auto.key=list(text=c("No-edu","Primary","Secondary","Tertiary"),reverse.row=TRUE,
+                            points=FALSE,rectangles=TRUE,space="right",columns=1,border=FALSE,
+                            title="ED-Level",cex.title=1.1,lines.title=2.5,padding.text=1,background="white"),
+            prepanel=prepanel.default.bwplot2,panel=function(...){
+                     panel.grid(h=length(agegrs),v=5,col="lightgrey",lty=3)
+                     panel.pyramid(...)
+                    })
>
> x # with strips for every factor over each panel
> # useOuterStrips(x) # with outer strips, but only in case of two factors
> useOuterStrips2(x) # with outer strips in case of three factors
>
> # compare different education-scenarios rather than countries
> Countries <- c("Pakistan")
> Scenarios <- c("FT","GET","CER")
> # the male-column needs to be flipped
> iEduDat <- subset(EduDat,match(cc,getcode(Countries,dictionary)) & match(yr,Years) & match(scen2,Scenarios))
> iEduDat$value[iEduDat$sex == "Male"] <- (-1) * iEduDat$value[iEduDat$sex == "Male"]
>
> lattice.options(axis.padding = list(numeric=0))
> x <- pyramidlattice(agegr ~ value| factor(sex,levels=c("Male","Female")) *
+                                    factor(scen2,levels=Scenarios,labels=Scenarios) *
+                                    factor(yr,levels=Years,labels=Years),
+            groups=variable,data=iEduDat,layout=c(length(Scenarios)*2,length(Years)),
+            type="l",lwd=1,xlab="Population",ylab="Age",main=paste("Population by Highest Level of Education, ",Countries,sep=""),
+            strip=TRUE,par.settings = simpleTheme(lwd=3,col=colors()[c(35,76,613,28)]),box.width=1,
+            scales=list(alternating=3,tick.number=5,relation="same",y=list(at=1:length(4:21),labels=agegrs)),
+            auto.key=list(text=c("No-edu","Primary","Secondary","Tertiary"),reverse.row=TRUE,
+                            points=FALSE,rectangles=TRUE,space="right",columns=1,border=FALSE,
+                            title="ED-Level",cex.title=1.1,lines.title=2.5,padding.text=1,background="white"),
+            prepanel=prepanel.default.bwplot2,panel=function(...){
+                     panel.grid(h=length(agegrs),v=5,col="lightgrey",lty=3)
+                     panel.pyramid(...)
+                    })
>
> x # with strips for every factor over each panel
> # useOuterStrips(x) # with outer strips, but only in case of two factors
> useOuterStrips2(x) # with outer strips in case of three factors
>
>
>
>
>
> dev.off()
null device
          1
>
|
Created & Maintained by Osamu Ogasawara (osamu.ogasawara@gmail.com) and 