Supported by Dr. Osamu Ogasawara and  . . |
|
Last data update: 2014.03.03 |
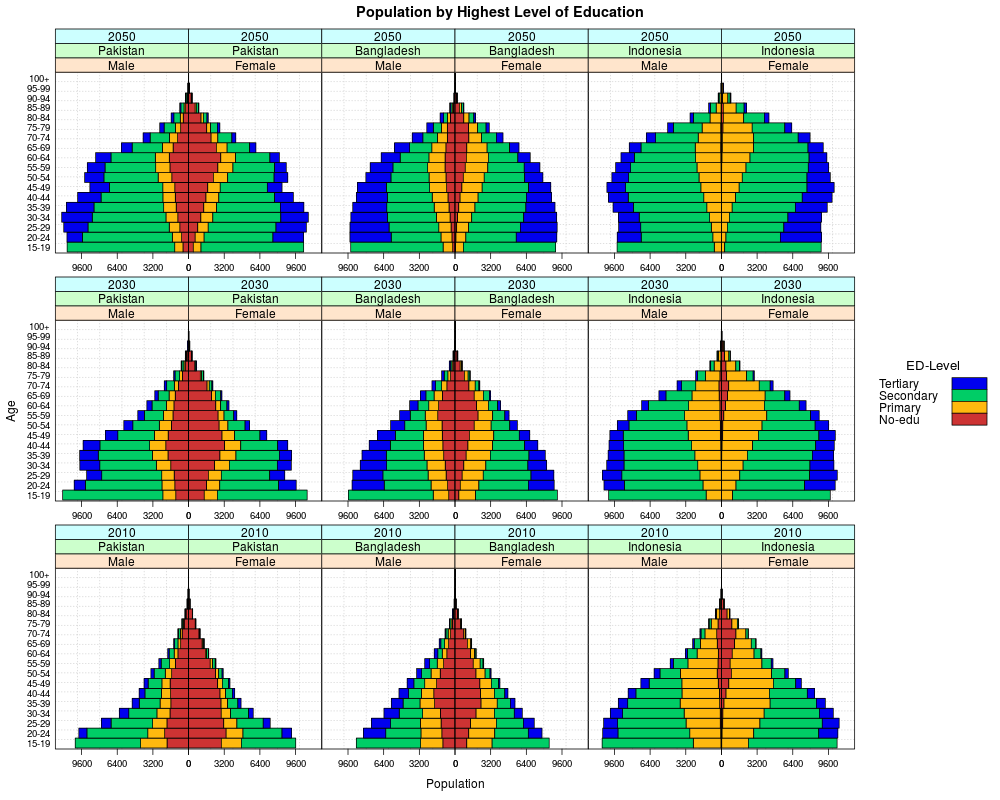
High level lattice-function producing population pyramidsDescriptionThis is the function used to produce stacked, horizontal barcharts for grouped data with varying x-scale limits to allow for distinction of i.e. male/female data points in population pyramid graphs. This is essentially a modification of barchart2 in package heR.Misc (see References). By calculating the x-scale limits properly and by allowing them to vary for male- and female-panels, 'pyramidlattice' produces population pyramids to compare population age-structures of countries in different years, as well as different scenarios for one and the same country in different years. In addition to that, useOuterStrips2() provides a possibility to draw parsimonious outer-strips for three factor variables which helps to save space in the plot window. Note that the values for the 'male'-column have to be flipped by hand before passing the data to 'pyramidlattice'. See examples below and ?barchart2 (heR.Misc) as well as ?xyplot (lattice) for details. Author(s)Erich Striessnig, adapted from the 'barchart2' function included in Neil Klepeis' heR.Misc package. ReferencesheR.Misc package source: http://www.exposurescience.org/heR.doc/library/heR.Misc/html/barchart2.html See Also'barchart' is the original lattice function for plotting (univariate) barcharts in each panel. 'barchart2' from heR.Misc package is Neil Klepeis' modification of barchart, dealing with grouped data by plotting stacked or side-by-side bars just like the bar plotting function in base R graphics. 'panel.pyramid' is the panel function used to plot group data as stacked bars. 'prepanel.default.bwplot2' is the prepanel function used to specify default (relation = same) horizontal and vertical limits for each panel for stacked bars. Yet, in order to get the reverse limits for the male and the female panels, the limits have to be passed on to pyramidlattice using the limits-argument in scale (see ?xyplot). Examples
data(EduDat)
data(dictionary)
# select the desired year, country, and education-scenario from EduDat
Years <- c(2010,2030,2050)
Countries <- c("Pakistan","Bangladesh","Indonesia")
Scenarios <- c("GET")
# the male-column needs to be flipped
iEduDat <- subset(EduDat,match(cc,getcode(Countries,dictionary)) & match(yr,Years) & match(scen2,Scenarios))
iEduDat$value[iEduDat$sex == "Male"] <- (-1) * iEduDat$value[iEduDat$sex == "Male"]
agegrs <- paste(seq(15,100,5),seq(19,104,5),sep="-")
agegrs[length(agegrs)] <- "100+"
lattice.options(axis.padding = list(numeric=0))
x <- pyramidlattice(agegr ~ value| factor(sex,levels=c("Male","Female")) *
factor(cc,levels=getcode(Countries,dictionary),labels=Countries) *
factor(yr,levels=Years,labels=Years),
groups=variable,data=iEduDat,layout=c(length(Countries)*2,length(Years)),
type="l",lwd=1,xlab="Population",ylab="Age",main="Population by Highest Level of Education",
strip=TRUE,par.settings = simpleTheme(lwd=3,col=colors()[c(35,76,613,28)]),box.width=1,
scales=list(alternating=3,tick.number=5,relation="same",y=list(at=1:length(4:21),labels=agegrs)),
auto.key=list(text=c("No-edu","Primary","Secondary","Tertiary"),reverse.row=TRUE,
points=FALSE,rectangles=TRUE,space="right",columns=1,border=FALSE,
title="ED-Level",cex.title=1.1,lines.title=2.5,padding.text=1,background="white"),
prepanel=prepanel.default.bwplot2,panel=function(...){
panel.grid(h=length(agegrs),v=5,col="lightgrey",lty=3)
panel.pyramid(...)
})
x # with strips for every factor over each panel
# useOuterStrips(x) # with outer strips, but only in case of two factors
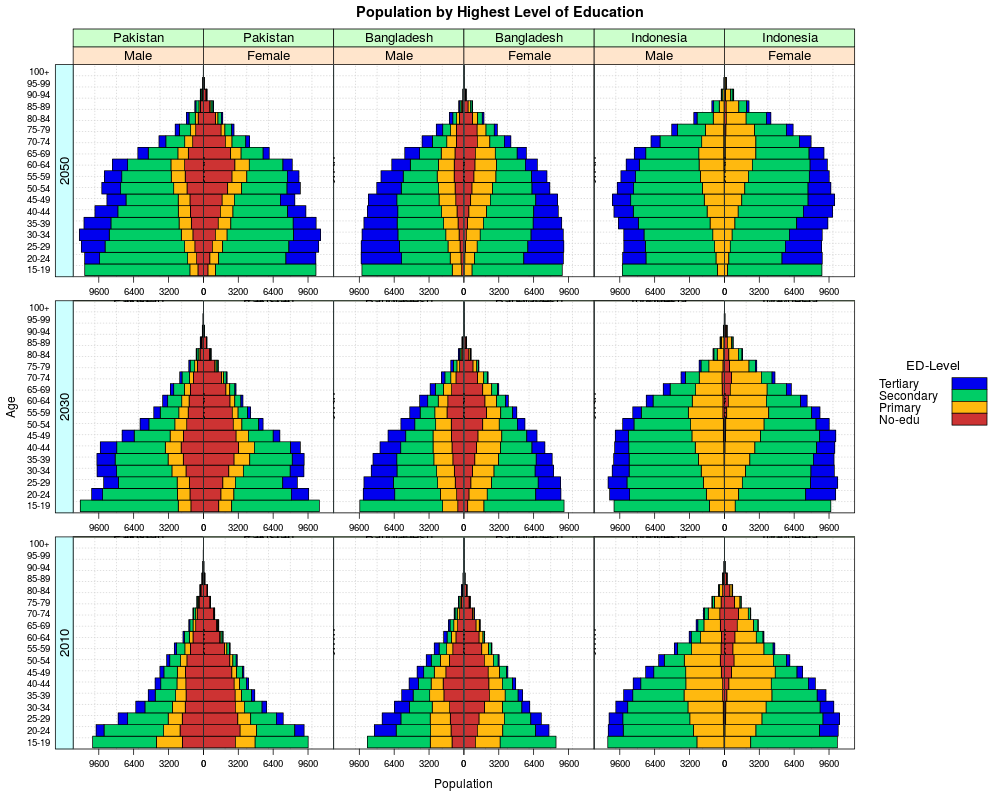
useOuterStrips2(x) # with outer strips in case of three factors
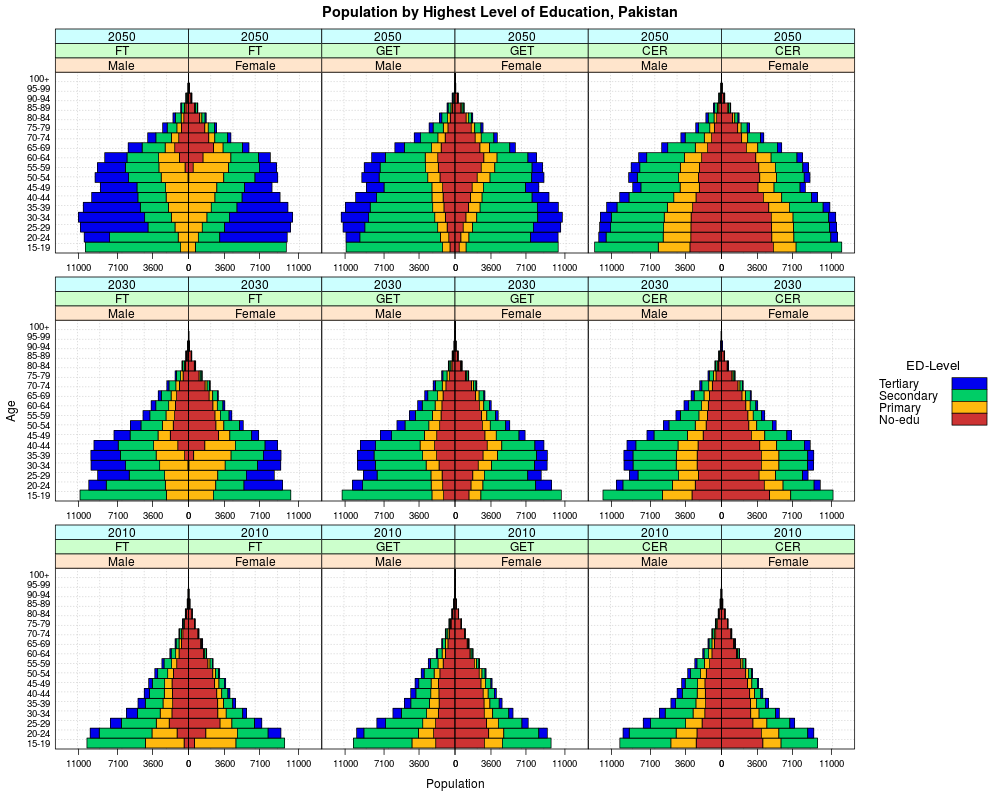
# compare different education-scenarios rather than countries
Countries <- c("Pakistan")
Scenarios <- c("FT","GET","CER")
# the male-column needs to be flipped
iEduDat <- subset(EduDat,match(cc,getcode(Countries,dictionary)) & match(yr,Years) & match(scen2,Scenarios))
iEduDat$value[iEduDat$sex == "Male"] <- (-1) * iEduDat$value[iEduDat$sex == "Male"]
lattice.options(axis.padding = list(numeric=0))
x <- pyramidlattice(agegr ~ value| factor(sex,levels=c("Male","Female")) *
factor(scen2,levels=Scenarios,labels=Scenarios) *
factor(yr,levels=Years,labels=Years),
groups=variable,data=iEduDat,layout=c(length(Scenarios)*2,length(Years)),
type="l",lwd=1,xlab="Population",ylab="Age",main=paste("Population by Highest Level of Education, ",Countries,sep=""),
strip=TRUE,par.settings = simpleTheme(lwd=3,col=colors()[c(35,76,613,28)]),box.width=1,
scales=list(alternating=3,tick.number=5,relation="same",y=list(at=1:length(4:21),labels=agegrs)),
auto.key=list(text=c("No-edu","Primary","Secondary","Tertiary"),reverse.row=TRUE,
points=FALSE,rectangles=TRUE,space="right",columns=1,border=FALSE,
title="ED-Level",cex.title=1.1,lines.title=2.5,padding.text=1,background="white"),
prepanel=prepanel.default.bwplot2,panel=function(...){
panel.grid(h=length(agegrs),v=5,col="lightgrey",lty=3)
panel.pyramid(...)
})
x # with strips for every factor over each panel
# useOuterStrips(x) # with outer strips, but only in case of two factors
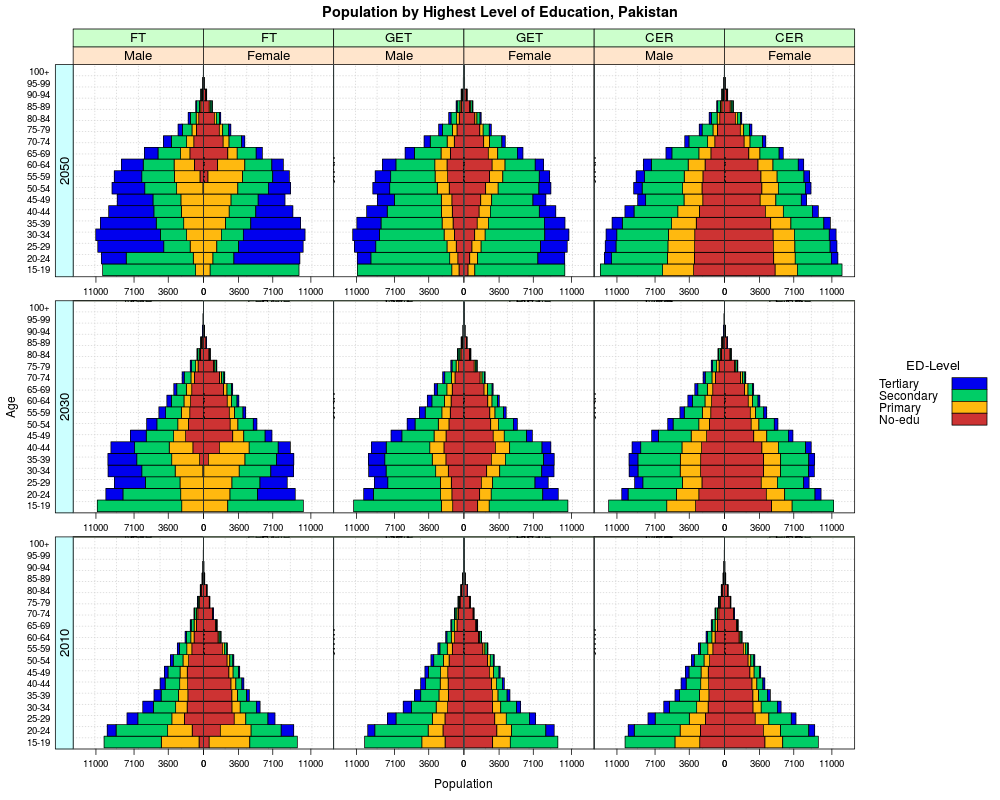
useOuterStrips2(x) # with outer strips in case of three factors
Results
R version 3.3.1 (2016-06-21) -- "Bug in Your Hair"
Copyright (C) 2016 The R Foundation for Statistical Computing
Platform: x86_64-pc-linux-gnu (64-bit)

R is free software and comes with ABSOLUTELY NO WARRANTY.
You are welcome to redistribute it under certain conditions.
Type 'license()' or 'licence()' for distribution details.

R is a collaborative project with many contributors.
Type 'contributors()' for more information and
'citation()' on how to cite R or R packages in publications.

Type 'demo()' for some demos, 'help()' for on-line help, or
'help.start()' for an HTML browser interface to help.
Type 'q()' to quit R.

> library(Giza)
Loading required package: reshape
Loading required package: lattice
> png(filename="/home/ddbj/snapshot/RGM3/R_CC/result/Giza/pyramidlattice.Rd_%03d_medium.png", width=480, height=480)
> ### Name: pyramidlattice
> ### Title: High level lattice-function producing population pyramids
> ### Aliases: pyramidlattice
>
> ### ** Examples
>
>
> data(EduDat)
> data(dictionary)
> # select the desired year, country, and education-scenario from EduDat
> Years <- c(2010,2030,2050)
> Countries <- c("Pakistan","Bangladesh","Indonesia")
> Scenarios <- c("GET")
> # the male-column needs to be flipped
> iEduDat <- subset(EduDat,match(cc,getcode(Countries,dictionary)) & match(yr,Years) & match(scen2,Scenarios))
> iEduDat$value[iEduDat$sex == "Male"] <- (-1) * iEduDat$value[iEduDat$sex == "Male"]
>
> agegrs <- paste(seq(15,100,5),seq(19,104,5),sep="-")
> agegrs[length(agegrs)] <- "100+"
>
> lattice.options(axis.padding = list(numeric=0))
> x <- pyramidlattice(agegr ~ value| factor(sex,levels=c("Male","Female")) *
+                                    factor(cc,levels=getcode(Countries,dictionary),labels=Countries) *
+                                    factor(yr,levels=Years,labels=Years),
+            groups=variable,data=iEduDat,layout=c(length(Countries)*2,length(Years)),
+            type="l",lwd=1,xlab="Population",ylab="Age",main="Population by Highest Level of Education",
+            strip=TRUE,par.settings = simpleTheme(lwd=3,col=colors()[c(35,76,613,28)]),box.width=1,
+            scales=list(alternating=3,tick.number=5,relation="same",y=list(at=1:length(4:21),labels=agegrs)),
+            auto.key=list(text=c("No-edu","Primary","Secondary","Tertiary"),reverse.row=TRUE,
+                            points=FALSE,rectangles=TRUE,space="right",columns=1,border=FALSE,
+                            title="ED-Level",cex.title=1.1,lines.title=2.5,padding.text=1,background="white"),
+            prepanel=prepanel.default.bwplot2,panel=function(...){
+                     panel.grid(h=length(agegrs),v=5,col="lightgrey",lty=3)
+                     panel.pyramid(...)
+                    })
>
> x # with strips for every factor over each panel
> # useOuterStrips(x) # with outer strips, but only in case of two factors
> useOuterStrips2(x) # with outer strips in case of three factors
>
> # compare different education-scenarios rather than countries
> Countries <- c("Pakistan")
> Scenarios <- c("FT","GET","CER")
> # the male-column needs to be flipped
> iEduDat <- subset(EduDat,match(cc,getcode(Countries,dictionary)) & match(yr,Years) & match(scen2,Scenarios))
> iEduDat$value[iEduDat$sex == "Male"] <- (-1) * iEduDat$value[iEduDat$sex == "Male"]
>
> lattice.options(axis.padding = list(numeric=0))
> x <- pyramidlattice(agegr ~ value| factor(sex,levels=c("Male","Female")) *
+                                    factor(scen2,levels=Scenarios,labels=Scenarios) *
+                                    factor(yr,levels=Years,labels=Years),
+            groups=variable,data=iEduDat,layout=c(length(Scenarios)*2,length(Years)),
+            type="l",lwd=1,xlab="Population",ylab="Age",main=paste("Population by Highest Level of Education, ",Countries,sep=""),
+            strip=TRUE,par.settings = simpleTheme(lwd=3,col=colors()[c(35,76,613,28)]),box.width=1,
+            scales=list(alternating=3,tick.number=5,relation="same",y=list(at=1:length(4:21),labels=agegrs)),
+            auto.key=list(text=c("No-edu","Primary","Secondary","Tertiary"),reverse.row=TRUE,
+                            points=FALSE,rectangles=TRUE,space="right",columns=1,border=FALSE,
+                            title="ED-Level",cex.title=1.1,lines.title=2.5,padding.text=1,background="white"),
+            prepanel=prepanel.default.bwplot2,panel=function(...){
+                     panel.grid(h=length(agegrs),v=5,col="lightgrey",lty=3)
+                     panel.pyramid(...)
+                    })
>
> x # with strips for every factor over each panel
> # useOuterStrips(x) # with outer strips, but only in case of two factors
> useOuterStrips2(x) # with outer strips in case of three factors
>
>
>
>
>
> dev.off()
null device
          1
>
|