Supported by Dr. Osamu Ogasawara and  . . |
|
Last data update: 2014.03.03 |
GmedianDescriptionComputes recursively the Geometric median (also named spatial median or L1-median) with a fast averaged stochastic gradient algorithms that can deal rapidly with large samples of high dimensional data. UsageGmedian(X, init = NULL, gamma = 2, alpha = 0.75, nstart=2, epsilon=1e-08) Arguments
DetailsThe recursive averaged algorithm is described in Cardot, Cenac, Zitt (2013), with descent steps defined as α_n = gamma/n^{alpha}. ValueVector of the geometric median. ReferencesCardot, H., Cenac, P. and Zitt, P-A. (2013). Efficient and fast estimation of the geometric median in Hilbert spaces with an averaged stochastic gradient algorithm. Bernoulli, 19, 18-43. See AlsoSee also Examples
## Simulated data - Brownian paths
n <- 1e4
d <- 500
x <- matrix(rnorm(n*d,sd=1/sqrt(d)), n, d)
x <- t(apply(x,1,cumsum))
## Computation speed
system.time(replicate(10, {
median.est = Gmedian(x)}))
system.time(replicate(10, {
mean.est = apply(x,2,mean)}))
##
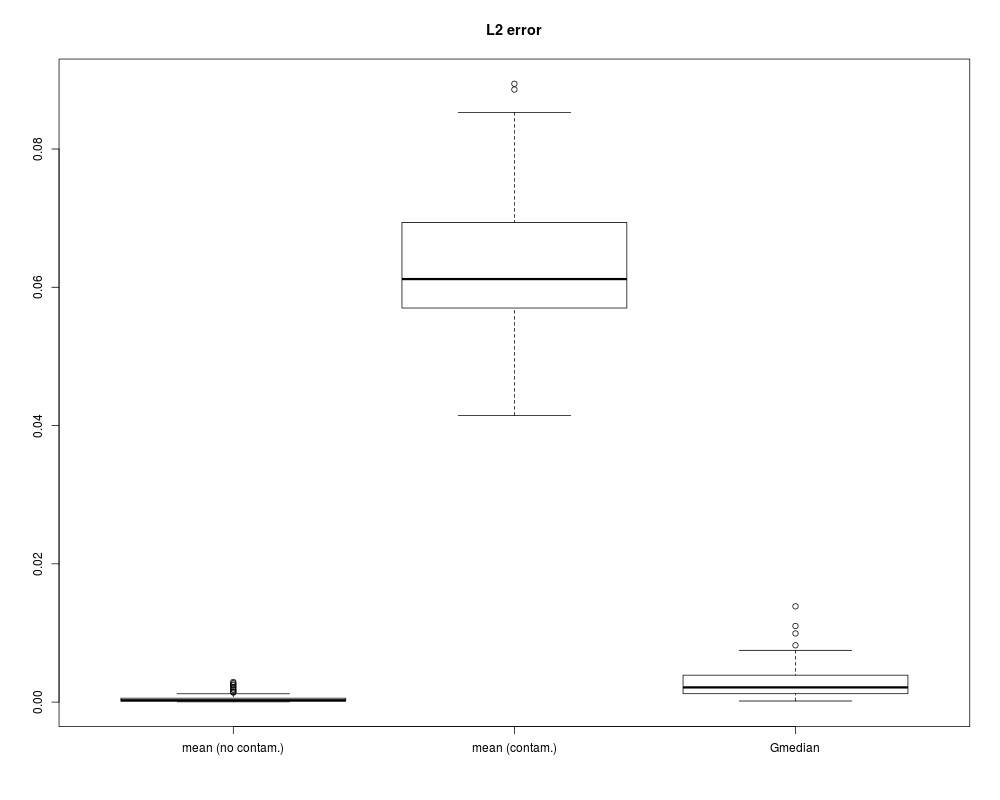
## Accuracy with contaminated data
n <- 1e03
d <- 100
n.contaminated <- 50 ## 5% of contaminated observations
n.experiment <- 100
err.L2 <- matrix(NA,ncol=3,nrow=n.experiment)
colnames(err.L2) = c("mean (no contam.)", "mean (contam.)","Gmedian")
for (n.sim in 1:n.experiment){
x <- matrix(rnorm(n*d,sd=1/sqrt(d)), n, d)
x <- t(apply(x,1,cumsum))
err.L2[n.sim,1] <- sum((apply(x,2,mean))^2/d)
ind.contaminated <- sample(1:n,n.contaminated) ## contam. units
x[ind.contaminated,] <- 5
err.L2[n.sim,2] <- sum((apply(x,2,mean))^2/d)
err.L2[n.sim,3] <- sum(Gmedian(x)^2/d)
}
boxplot(err.L2,main="L2 error")
Results
R version 3.3.1 (2016-06-21) -- "Bug in Your Hair"
Copyright (C) 2016 The R Foundation for Statistical Computing
Platform: x86_64-pc-linux-gnu (64-bit)

R is free software and comes with ABSOLUTELY NO WARRANTY.
You are welcome to redistribute it under certain conditions.
Type 'license()' or 'licence()' for distribution details.

R is a collaborative project with many contributors.
Type 'contributors()' for more information and
'citation()' on how to cite R or R packages in publications.

Type 'demo()' for some demos, 'help()' for on-line help, or
'help.start()' for an HTML browser interface to help.
Type 'q()' to quit R.

> library(Gmedian)
> png(filename="/home/ddbj/snapshot/RGM3/R_CC/result/Gmedian/Gmedian.Rd_%03d_medium.png", width=480, height=480)
> ### Name: Gmedian
> ### Title: Gmedian
> ### Aliases: Gmedian
> ### Keywords: Gmedian
>
> ### ** Examples
>
> ## Simulated data - Brownian paths
> n <- 1e4
> d <- 500
> x <- matrix(rnorm(n*d,sd=1/sqrt(d)), n, d)
> x <- t(apply(x,1,cumsum))
>
> ## Computation speed
> system.time(replicate(10, {
+   median.est = Gmedian(x)}))
   user  system elapsed
  0.448   0.040   0.491
> system.time(replicate(10, {
+   mean.est = apply(x,2,mean)}))
   user  system elapsed
  0.756   0.092   0.849
> ##
>
> ## Accuracy with contaminated data
> n <- 1e03
> d <- 100
> n.contaminated <- 50 ## 5% of contaminated observations
> n.experiment <- 100
> err.L2 <- matrix(NA,ncol=3,nrow=n.experiment)
> colnames(err.L2) = c("mean (no contam.)", "mean (contam.)","Gmedian")
>
> for (n.sim in 1:n.experiment){
+ x <- matrix(rnorm(n*d,sd=1/sqrt(d)), n, d)
+ x <- t(apply(x,1,cumsum))
+ err.L2[n.sim,1] <- sum((apply(x,2,mean))^2/d)
+ ind.contaminated <- sample(1:n,n.contaminated) ## contam. units
+ x[ind.contaminated,] <- 5
+ err.L2[n.sim,2] <- sum((apply(x,2,mean))^2/d)
+ err.L2[n.sim,3] <- sum(Gmedian(x)^2/d)
+ }
> boxplot(err.L2,main="L2 error")
>
>
>
>
>
> dev.off()
null device
          1
>
|