This is a general form of bezier line that can be used for cubic, quadratic,
and more advanced Bezier lines.
Usage
gnrlBezierPoints(ctrl_points, length_out = 100L)
Arguments
ctrl_points
The ctrl_points for the bezier control points. This should
either be a matrix or a data.frame.
length_out
The length of the return points, i.e. how fine
detailed the points should be.
Examples
library(grid)
grid.newpage()
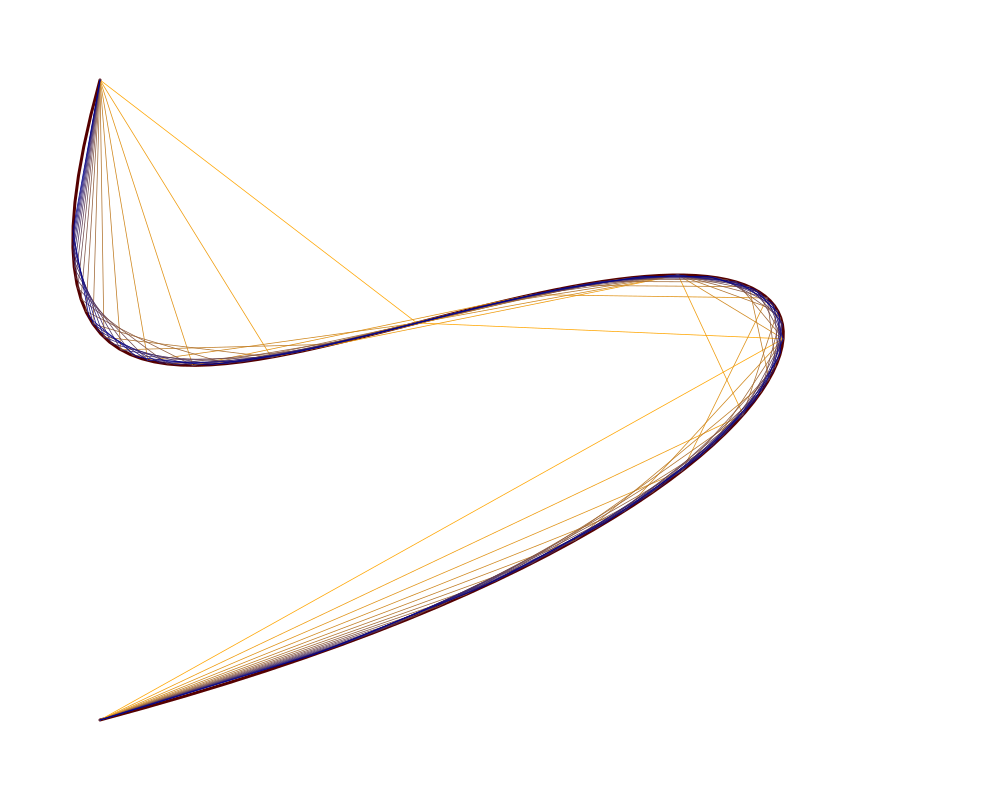
l <- gnrlBezierPoints(data.frame(x = c(.1, -.1, .7, 1, 1, 0.1),
y = c(.9, 0, 1, .8, .4, .1)),
length_out = 100)
grid.lines(l[,1], l[,2], gp=gpar(col="#550000", lwd = 4))
out_sizes <- 4:20
clrs <- colorRampPalette(c("orange", "darkblue"))(length(out_sizes))
for (i in out_sizes){
l <- gnrlBezierPoints(data.frame(x = c(.1, -.1, .7, 1, 1, 0.1),
y = c(.9, 0, 1, .8, .4, .1)),
length_out = i)
grid.lines(l[,1], l[,2],
gp=gpar(col=clrs[which(i == out_sizes)]))
}
Results
R version 3.3.1 (2016-06-21) -- "Bug in Your Hair"
Copyright (C) 2016 The R Foundation for Statistical Computing
Platform: x86_64-pc-linux-gnu (64-bit)

R is free software and comes with ABSOLUTELY NO WARRANTY.
You are welcome to redistribute it under certain conditions.
Type 'license()' or 'licence()' for distribution details.

R is a collaborative project with many contributors.
Type 'contributors()' for more information and
'citation()' on how to cite R or R packages in publications.

Type 'demo()' for some demos, 'help()' for on-line help, or
'help.start()' for an HTML browser interface to help.
Type 'q()' to quit R.

> library(Gmisc)
Loading required package: Rcpp
Loading required package: htmlTable
> png(filename="/home/ddbj/snapshot/RGM3/R_CC/result/Gmisc/gnrlBezierPoints.Rd_%03d_medium.png", width=480, height=480)
> ### Name: gnrlBezierPoints
> ### Title: Generates a generalized Bezier line
> ### Aliases: gnrlBezierPoints
>
> ### ** Examples
>
> library(grid)
> grid.newpage()
> l <- gnrlBezierPoints(data.frame(x = c(.1, -.1, .7, 1, 1, 0.1),
+                                  y = c(.9, 0, 1, .8, .4, .1)),
+                       length_out = 100)
> grid.lines(l[,1], l[,2], gp=gpar(col="#550000", lwd = 4))
>
> out_sizes <- 4:20
> clrs <- colorRampPalette(c("orange", "darkblue"))(length(out_sizes))
> for (i in out_sizes){
+    l <- gnrlBezierPoints(data.frame(x = c(.1, -.1, .7, 1, 1, 0.1),
+                                     y = c(.9, 0, 1, .8, .4, .1)),
+                          length_out = i)
+    grid.lines(l[,1], l[,2],
+    gp=gpar(col=clrs[which(i == out_sizes)]))
+ }
>
>
>
>
>
> dev.off()
null device
          1
>
 .
.