Last data update: 2014.03.03

R: Forest plot for multiple models
forestplotRegrObjR Documentation

Forest plot for multiple models

Description

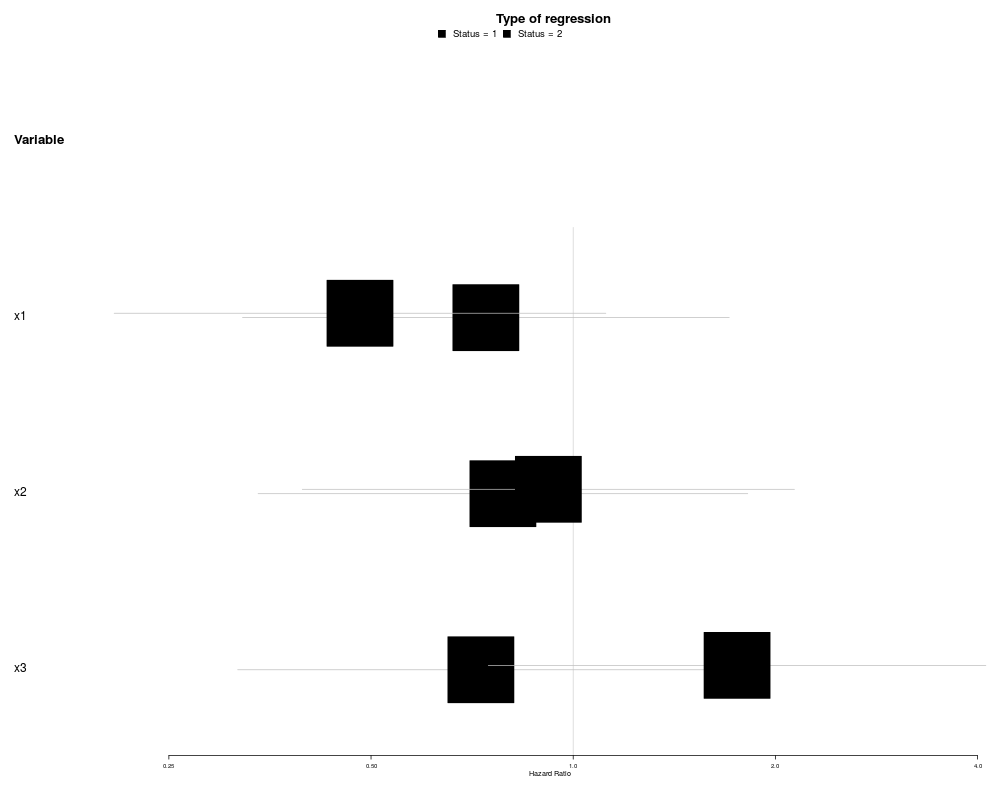
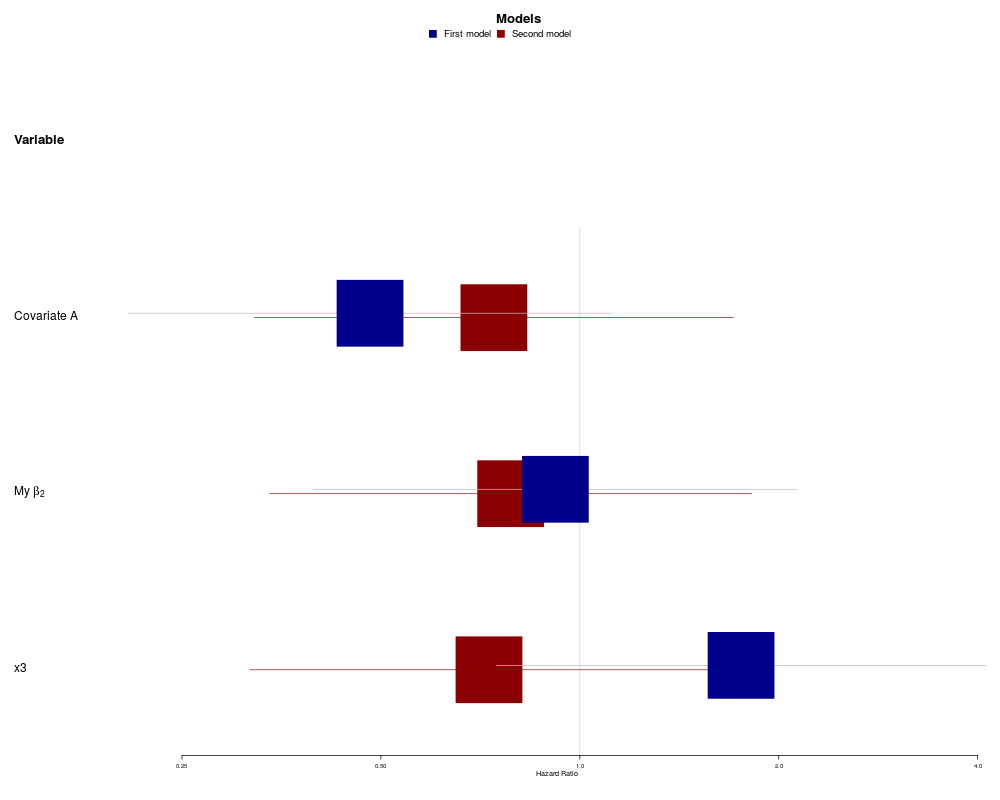
Plot different model fits with similar variables in order to compare the model's estimates and confidence intervals. Each model is represented by a separate line on top of eachother and are therefore ideal for comparing different models. This extra appealing when you have lots of variables included in the models.

Usage

forestplotRegrObj(regr.obj, skip.variables, add.empty_row, order.regexps,
  order.addrows, box.default.size, rowname.fn, xlab, xlog, exp,
  estimate.txt = xlab, zero, get_box_size = fpBoxSize, ...)

fpBoxSize(p_values, variable_count, box.default.size, significant = 0.05)

Arguments

regr.obj

A regression model object. It should be of coxph, crr or glm class. Warning: The glm is not fully tested.

skip.variables

Which variables to use. The variables should be the names of the fit output and not the true output names if you're using the rowname_translate_function.

add.empty_row

Add empty rows. This can either be a vector or a list. When you have a vector the number indicates the row number where the empty row should be added, the format is: c(3, 5). If you give a list you have the option of specifying the name of the row, the format is: list(list(3, "my rowname"), list(5, "my other rowname")). The rows will be added at the 3rd row and 5th row from the original position. Ie you don't have take into account that the 5:th row will be at the 6:th position after adding the 3rd row.

order.regexps

A regexp vector that searches for matches along the original rownames and reorders according to those.

order.addrows

If there are ordered groups then often you want empty rows that separate the different groups. Set this to true if you want to add these empty rows between groups.

box.default.size

The default box size

rowname.fn

A function that takes a rowname and sees if it needs beautifying. The function has only one parameter the coefficients name and should return a string or expression.

xlab

x-axis label

xlog

If TRUE, x-axis tick marks are to follow a logarithmic scale, e.g. for logistic regressoin (OR), survival estimates (HR), poisson regression etc. Note: This is an intentional break with the original forestplot function as I've found that exponentiated ticks/clips/zero effect are more difficult to for non-statisticians and there are sometimes issues with rounding the tick marks properly.
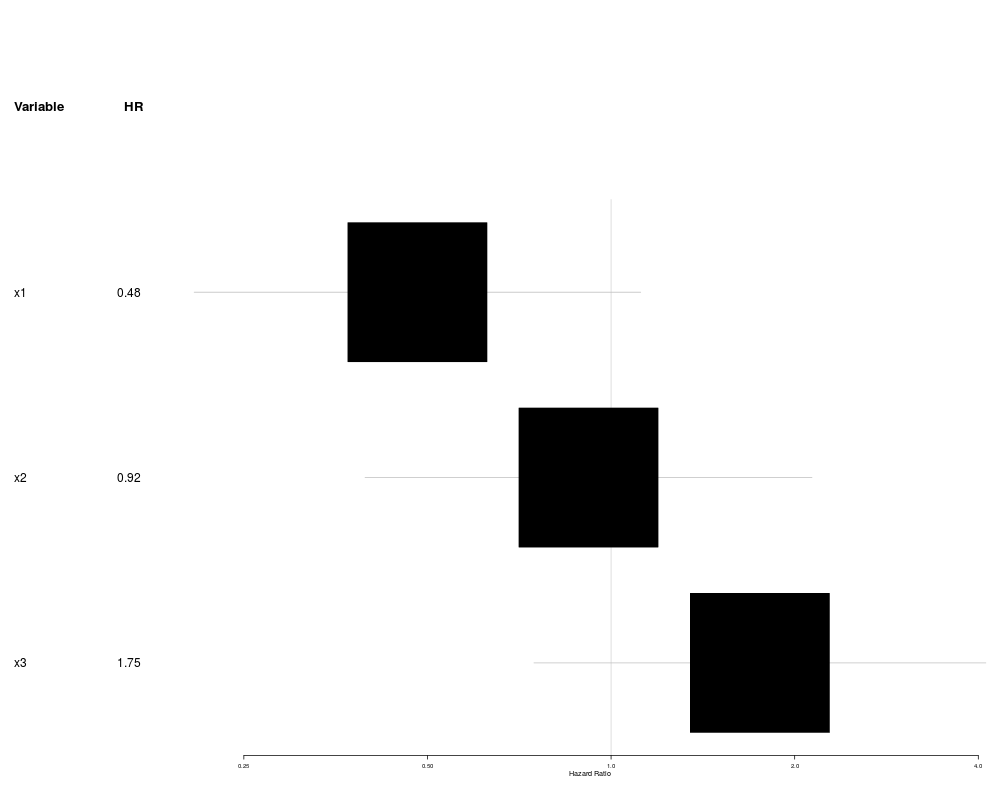
exp

Report in exponential form. Default true since the function was built for use with survival models.

estimate.txt

The text of the estimate, usually HR for hazard ratio, OR for odds ratio

zero

Indicates what is zero effect. For survival/logistic fits the zero is 1 while in most other cases it's 0.

get_box_size

A function for extracting the box sizes

...

Passed to forestplot

p_values

The p-values that will work as the foundation for the box size

variable_count

The number of variables

significant

Level of significance .05

See Also

Other forestplot wrappers: forestplotCombineRegrObj

Examples

org.par <- par("ask" = TRUE)

# simulated data to test 
set.seed(10)
ftime <- rexp(200)
fstatus <- sample(0:2,200,replace=TRUE)
cov <- data.frame(
		x1 = runif(200),
		x2 = runif(200),
		x3 = runif(200))

library(rms)
dd <- datadist(cov)
options(datadist="dd")

fit1 <- cph(Surv(ftime, fstatus == 1) ~ x1 + x2 + x3, data=cov)
fit2 <- cph(Surv(ftime, fstatus == 2) ~ x1 + x2 + x3, data=cov)

forestplotRegrObj (regr.obj = fit1, new_page=TRUE)

library(forestplot)
forestplotRegrObj (regr.obj = list(fit1, fit2),
                   legend = c("Status = 1", "Status = 2"), 
                   legend_args = fpLegend(title="Type of regression"),
                   new_page=TRUE)
  
modifyNameFunction <- function(x){
  if (x == "x1")
    return ("Covariate A")
  
  if (x == "x2")
    return (expression(paste("My ", beta[2])))
  
  return (x)
}

forestplotRegrObj (regr.obj = list(fit1, fit2), 
                   col=fpColors(box=c("darkblue", "darkred")),
                   variablesOfInterest.regexp = "(x2|x3)",
                   legend = c("First model", "Second model"),
                   legend_args = fpLegend(title = "Models"),
                   rowname.fn = modifyNameFunction, new_page=TRUE)
  
par(org.par)

Results


R version 3.3.1 (2016-06-21) -- "Bug in Your Hair"
Copyright (C) 2016 The R Foundation for Statistical Computing
Platform: x86_64-pc-linux-gnu (64-bit)

R is free software and comes with ABSOLUTELY NO WARRANTY.
You are welcome to redistribute it under certain conditions.
Type 'license()' or 'licence()' for distribution details.

R is a collaborative project with many contributors.
Type 'contributors()' for more information and
'citation()' on how to cite R or R packages in publications.

Type 'demo()' for some demos, 'help()' for on-line help, or
'help.start()' for an HTML browser interface to help.
Type 'q()' to quit R.

> library(Greg)
Loading required package: forestplot
Loading required package: grid
Loading required package: magrittr
Loading required package: Gmisc
Loading required package: Rcpp
Loading required package: htmlTable
> png(filename="/home/ddbj/snapshot/RGM3/R_CC/result/Greg/forestplotRegrObj.Rd_%03d_medium.png", width=480, height=480)
> ### Name: forestplotRegrObj
> ### Title: Forest plot for multiple models
> ### Aliases: forestplotRegrObj fpBoxSize
> 
> ### ** Examples
> 
> org.par <- par("ask" = TRUE)
> 
> # simulated data to test 
> set.seed(10)
> ftime <- rexp(200)
> fstatus <- sample(0:2,200,replace=TRUE)
> cov <- data.frame(
+ 		x1 = runif(200),
+ 		x2 = runif(200),
+ 		x3 = runif(200))
> 
> library(rms)
Loading required package: Hmisc
Loading required package: lattice
Loading required package: survival
Loading required package: Formula
Loading required package: ggplot2

Attaching package: 'Hmisc'

The following objects are masked from 'package:base':

    format.pval, round.POSIXt, trunc.POSIXt, units

Loading required package: SparseM

Attaching package: 'SparseM'

The following object is masked from 'package:base':

    backsolve

> dd <- datadist(cov)
> options(datadist="dd")
> 
> fit1 <- cph(Surv(ftime, fstatus == 1) ~ x1 + x2 + x3, data=cov)
> fit2 <- cph(Surv(ftime, fstatus == 2) ~ x1 + x2 + x3, data=cov)
> 
> forestplotRegrObj (regr.obj = fit1, new_page=TRUE)
> 
> library(forestplot)
> forestplotRegrObj (regr.obj = list(fit1, fit2),
+                    legend = c("Status = 1", "Status = 2"), 
+                    legend_args = fpLegend(title="Type of regression"),
+                    new_page=TRUE)
>   
> modifyNameFunction <- function(x){
+   if (x == "x1")
+     return ("Covariate A")
+   
+   if (x == "x2")
+     return (expression(paste("My ", beta[2])))
+   
+   return (x)
+ }
> 
> forestplotRegrObj (regr.obj = list(fit1, fit2), 
+                    col=fpColors(box=c("darkblue", "darkred")),
+                    variablesOfInterest.regexp = "(x2|x3)",
+                    legend = c("First model", "Second model"),
+                    legend_args = fpLegend(title = "Models"),
+                    rowname.fn = modifyNameFunction, new_page=TRUE)
>   
> par(org.par)
> 
> 
> 
> 
> 
> dev.off()
null device 
          1 
>