Supported by Dr. Osamu Ogasawara and  . . |
|
Last data update: 2014.03.03 |
Map of France in 1830 with the Guerry dataDescription
Usagedata(gfrance) FormatThe format is:
Formal class 'SpatialPolygonsDataFrame' [package "sp"] with 5 slots: The analysis variables are described in DetailsIn the present version, the PROJ4 projection is not specified. SourceFriendly, M. (2007). Supplementary materials for André-Michel Guerry's Moral Statistics of France: Challenges for Multivariate Spatial Analysis, http://www.math.yorku.ca/SCS/Gallery/guerry/. ReferencesFriendly, M. (2007). A.-M. Guerry's Moral Statistics of France: Challenges for Multivariable Spatial Analysis. Statistical Science, 22, 368-399. See Also
Examples
data(gfrance)
names(gfrance) ## list @data variables
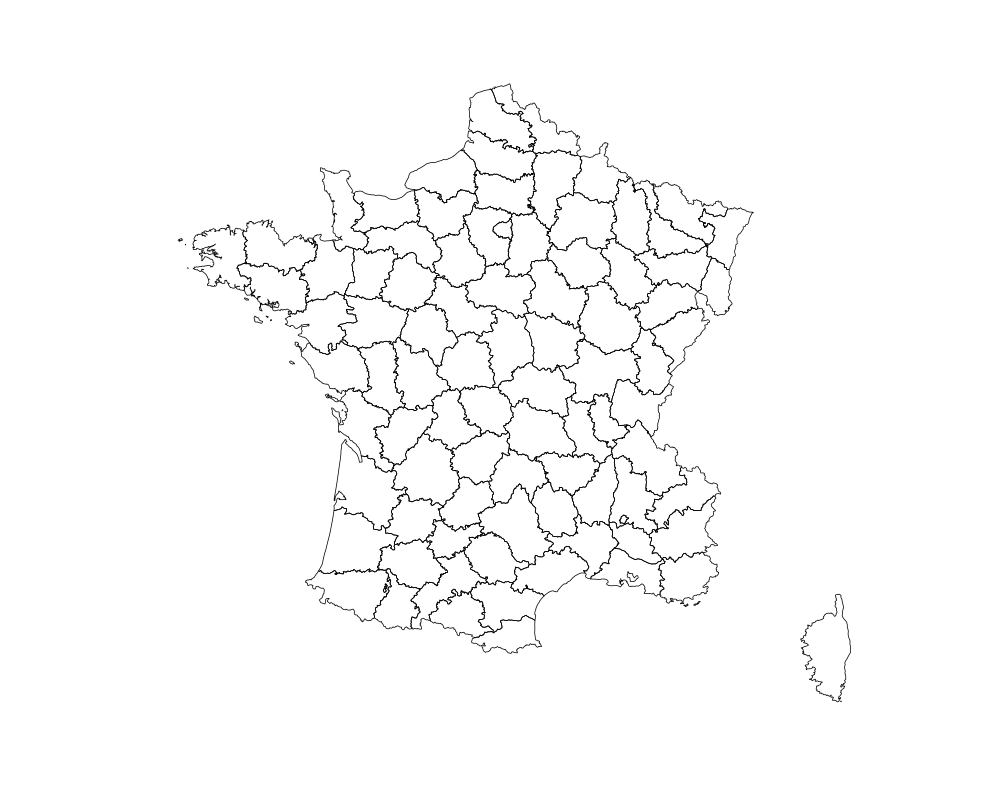
plot(gfrance) ## just show the map outline
# Show basic choropleth plots of some of the variables
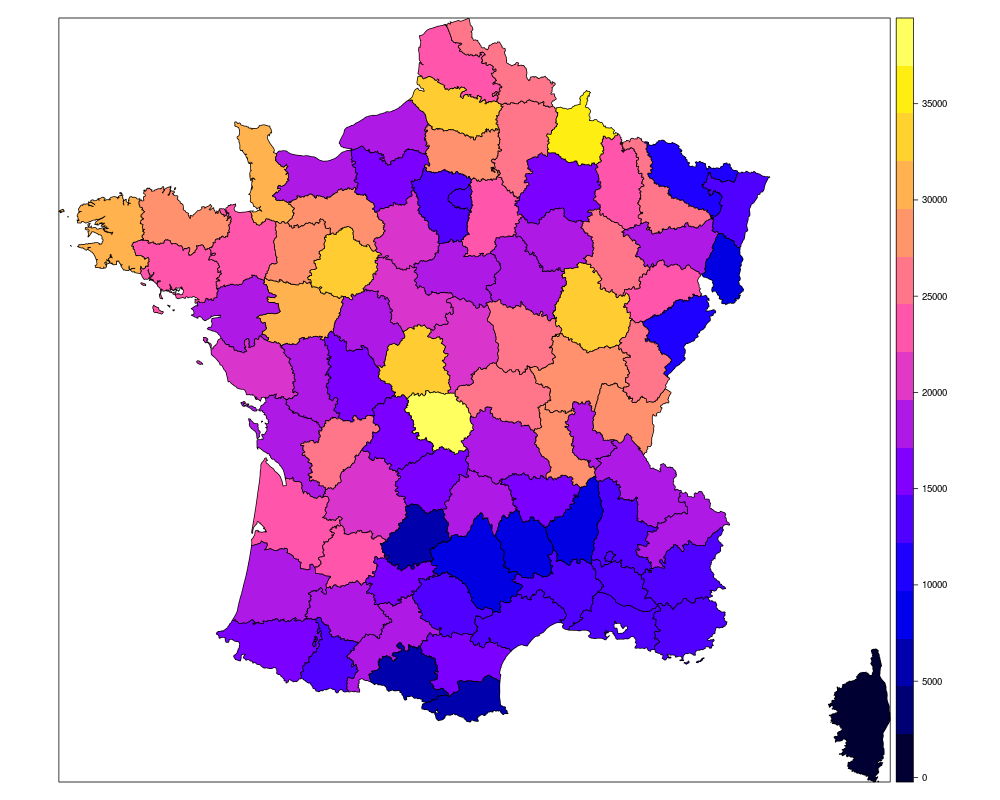
spplot(gfrance, "Crime_pers")
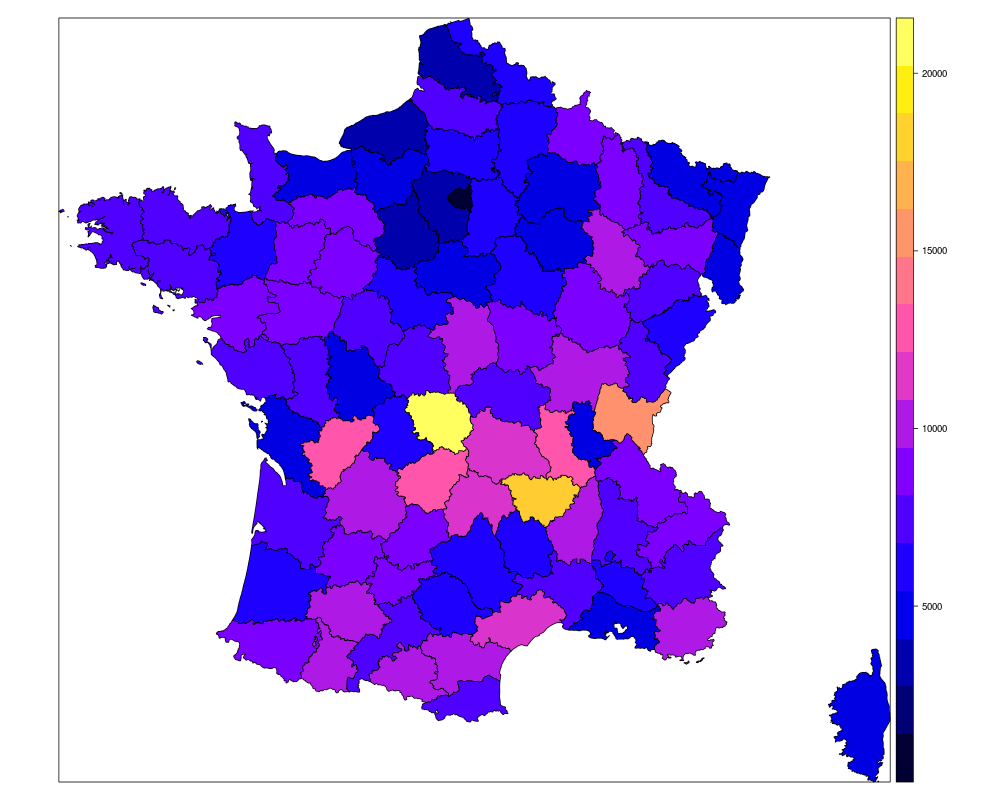
spplot(gfrance, "Crime_prop")
# Note that spplot assumes all variables are on the same scale for comparative plots
# transform variables to ranks (as Guerry did)
## Not run:
local({
gfrance$Crime_pers <- rank(gfrance$Crime_pers)
gfrance$Crime_prop <- rank(gfrance$Crime_prop)
gfrance$Literacy <- rank(gfrance$Literacy)
gfrance$Donations <- rank(gfrance$Donations)
gfrance$Infants <- rank(gfrance$Infants)
gfrance$Suicides <- rank(gfrance$Suicides)
spplot(gfrance, c("Crime_pers", "Crime_prop", "Literacy", "Donations", "Infants", "Suicides"),
layout=c(3,2), as.table=TRUE, main="Guerry's main moral variables")
})
## End(Not run)
Results
R version 3.3.1 (2016-06-21) -- "Bug in Your Hair"
Copyright (C) 2016 The R Foundation for Statistical Computing
Platform: x86_64-pc-linux-gnu (64-bit)

R is free software and comes with ABSOLUTELY NO WARRANTY.
You are welcome to redistribute it under certain conditions.
Type 'license()' or 'licence()' for distribution details.

R is a collaborative project with many contributors.
Type 'contributors()' for more information and
'citation()' on how to cite R or R packages in publications.

Type 'demo()' for some demos, 'help()' for on-line help, or
'help.start()' for an HTML browser interface to help.
Type 'q()' to quit R.

> library(Guerry)
> png(filename="/home/ddbj/snapshot/RGM3/R_CC/result/Guerry/gfrance.Rd_%03d_medium.png", width=480, height=480)
> ### Name: gfrance
> ### Title: Map of France in 1830 with the Guerry data
> ### Aliases: gfrance
> ### Keywords: datasets spatial
>
> ### ** Examples
>
> data(gfrance)
> names(gfrance)  ## list @data variables
Loading required package: sp
 [1] "CODE_DEPT"       "COUNT"           "AVE_ID_GEO"      "dept"
 [5] "Region"          "Department"      "Crime_pers"      "Crime_prop"
 [9] "Literacy"        "Donations"       "Infants"         "Suicides"
[13] "MainCity"        "Wealth"          "Commerce"        "Clergy"
[17] "Crime_parents"   "Infanticide"     "Donation_clergy" "Lottery"
[21] "Desertion"       "Instruction"     "Prostitutes"     "Distance"
[25] "Area"            "Pop1831"
> plot(gfrance)   ## just show the map outline
>
> # Show basic choropleth plots of some of the variables
> spplot(gfrance, "Crime_pers")
> spplot(gfrance, "Crime_prop")
>
> # Note that spplot assumes all variables are on the same scale for comparative plots
> # transform variables to ranks (as Guerry did)
>
> ## Not run:
> ##D local({
> ##D   gfrance$Crime_pers <- rank(gfrance$Crime_pers)
> ##D   gfrance$Crime_prop <- rank(gfrance$Crime_prop)
> ##D   gfrance$Literacy <- rank(gfrance$Literacy)
> ##D   gfrance$Donations <- rank(gfrance$Donations)
> ##D   gfrance$Infants <- rank(gfrance$Infants)
> ##D   gfrance$Suicides <- rank(gfrance$Suicides)
> ##D
> ##D   spplot(gfrance, c("Crime_pers", "Crime_prop", "Literacy", "Donations", "Infants", "Suicides"),
> ##D     layout=c(3,2), as.table=TRUE, main="Guerry's main moral variables")
> ##D })
> ## End(Not run)
>
>
>
>
>
> dev.off()
null device
          1
>
|