Supported by Dr. Osamu Ogasawara and  . . |
|
Last data update: 2014.03.03 |
Map of France in 1830 with the Guerry data, excluding CorsicaDescription
Usagedata(gfrance85) FormatThe format is:
Formal class 'SpatialPolygonsDataFrame' [package "sp"] with 5 slots: The analysis variables are described in DetailsIn the present version, the PROJ4 projection is not specified. SourceFriendly, M. (2007). Supplementary materials for André-Michel Guerry's Moral Statistics of France: Challenges for Multivariate Spatial Analysis, http://www.math.yorku.ca/SCS/Gallery/guerry/. ReferencesDray, S. and Jombart, T. (2009). A Revisit Of Guerry's Data: Introducing Spatial Constraints In Multivariate Analysis. Unpublished manuscript. Friendly, M. (2007). A.-M. Guerry's Moral Statistics of France: Challenges for Multivariable Spatial Analysis. Statistical Science, 22, 368-399. Examples
data(gfrance85)
require(sp)
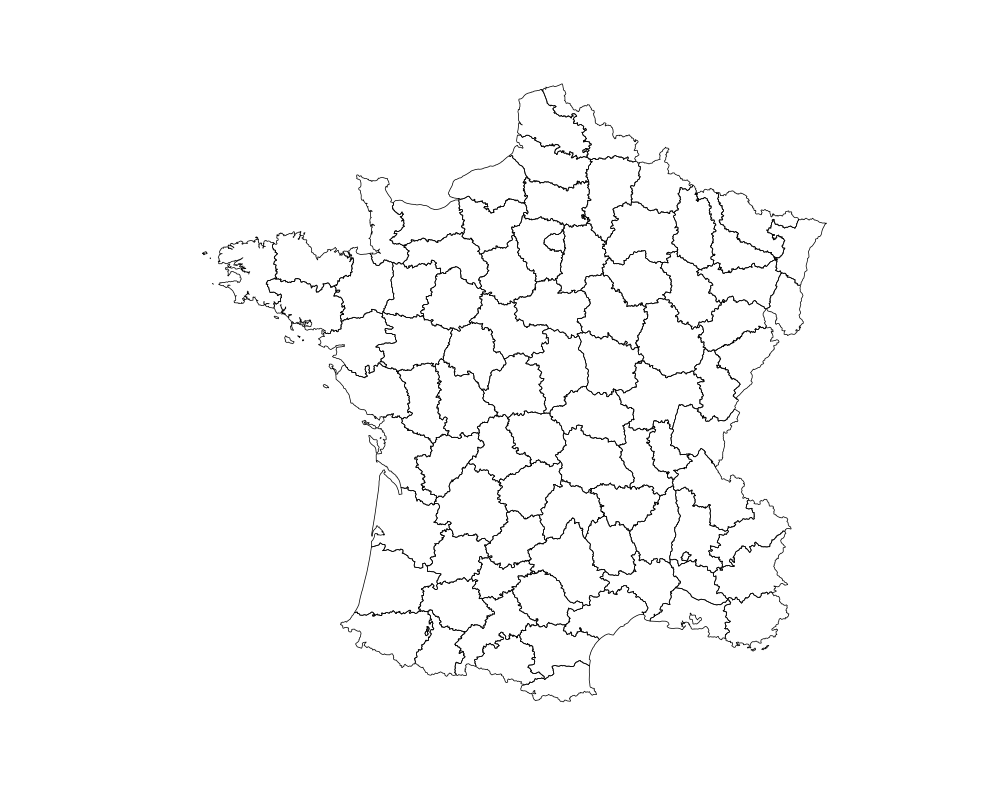
plot(gfrance85) # plot the empty outline map
# extract some useful components
df <- data.frame(gfrance85)[,7:12] # main moral variables
xy <- coordinates(gfrance85) # department centroids
dep.names <- data.frame(gfrance85)[,6]
region.names <- data.frame(gfrance85)[,5]
col.region <- colors()[c(149,254,468,552,26)]
if (require(spdep)) {
lw <- nb2listw(poly2nb(gfrance85)) # neighbors list
}
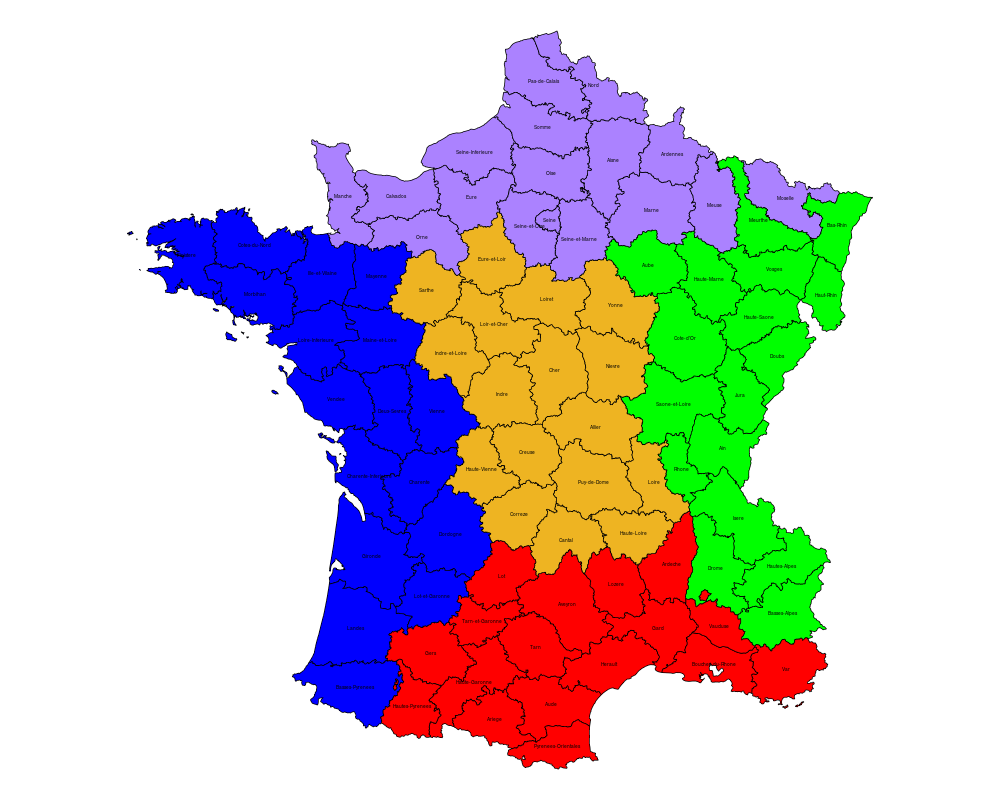
# plot the map showing regions by color with department labels
op <-par(mar=rep(0.1,4))
plot(gfrance85,col=col.region[region.names])
text(xy, labels=dep.names, cex=0.4)
par(op)
Results
R version 3.3.1 (2016-06-21) -- "Bug in Your Hair"
Copyright (C) 2016 The R Foundation for Statistical Computing
Platform: x86_64-pc-linux-gnu (64-bit)

R is free software and comes with ABSOLUTELY NO WARRANTY.
You are welcome to redistribute it under certain conditions.
Type 'license()' or 'licence()' for distribution details.

R is a collaborative project with many contributors.
Type 'contributors()' for more information and
'citation()' on how to cite R or R packages in publications.

Type 'demo()' for some demos, 'help()' for on-line help, or
'help.start()' for an HTML browser interface to help.
Type 'q()' to quit R.

> library(Guerry)
> png(filename="/home/ddbj/snapshot/RGM3/R_CC/result/Guerry/gfrance85.Rd_%03d_medium.png", width=480, height=480)
> ### Name: gfrance85
> ### Title: Map of France in 1830 with the Guerry data, excluding Corsica
> ### Aliases: gfrance85
> ### Keywords: datasets spatial
>
> ### ** Examples
>
> data(gfrance85)
> require(sp)
Loading required package: sp
> plot(gfrance85)   # plot the empty outline map
>
> # extract some useful components
> df <- data.frame(gfrance85)[,7:12]       # main moral variables
> xy <- coordinates(gfrance85)             # department centroids
> dep.names <- data.frame(gfrance85)[,6]
> region.names <- data.frame(gfrance85)[,5]
> col.region <- colors()[c(149,254,468,552,26)]
>
> if (require(spdep)) {
+   lw <- nb2listw(poly2nb(gfrance85))       # neighbors list
+ }
Loading required package: spdep
Loading required package: Matrix
>
> # plot the map showing regions by color with department labels
> op <-par(mar=rep(0.1,4))
> plot(gfrance85,col=col.region[region.names])
> text(xy, labels=dep.names, cex=0.4)
> par(op)
>
>
>
>
>
>
>
> dev.off()
null device
          1
>
|