Supported by Dr. Osamu Ogasawara and  . . |
|
Last data update: 2014.03.03 |
AlignedReadTrack class and methods (NOTE: THIS IS STILL IN DEVELOPMENT AND SUBJECT TO CHANGE)DescriptionA class to represent short sequences that have been aligned to a reference genome as they are typically generated in a next generation sequencing experiment. UsageAlignedReadTrack(range=NULL, start=NULL, end=NULL, width=NULL, chromosome, strand, genome, stacking="squish", name="AlignedReadTrack", coverageOnly=FALSE, ...) Arguments
ValueThe return value of the constructor function is a new object of class
Objects from the ClassObjects can be created using the constructor function Slots
ExtendsClass Class Class MethodsIn the following code chunks, Exported in the name space:
Internal methods:
Inherited methods:
Display ParametersThe following display parameters are set for objects of class
Additional display parameters are being inherited from the respective
parent classes. Note that not all of them may have an effect on the
plotting of
Author(s)Florian Hahne See Also
Examples
## Construct from individual arguments
arTrack <- AlignedReadTrack(start=runif(1000, 100, 200), width=24,
genome="mm9", chromosome=7, strand=sample(c("+", "-"), 1000, TRUE))
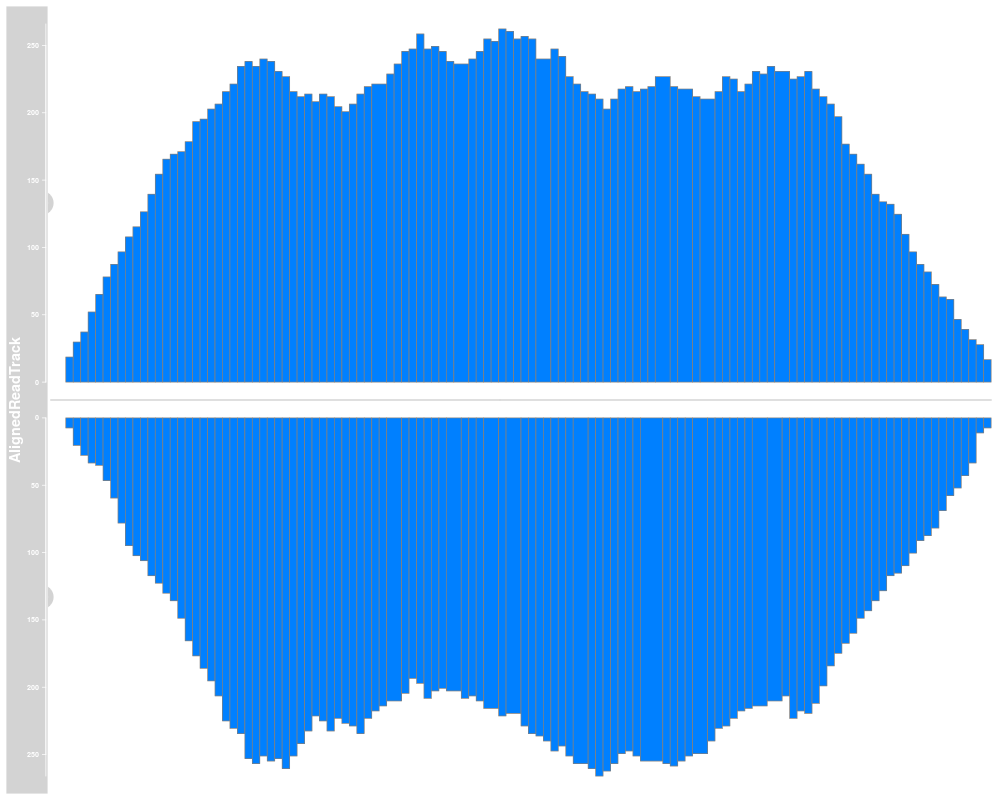
## Plotting
plotTracks(arTrack)
## Track names
names(arTrack)
names(arTrack) <- "foo"
plotTracks(arTrack)
## Subsetting and splitting
subTrack <- subset(arTrack, from=110, to=130)
length(subTrack)
subTrack[1:2]
split(arTrack, strand(arTrack))
## Accessors
start(arTrack)
end(arTrack)
width(arTrack)
position(arTrack)
width(subTrack) <- 30
strand(arTrack)
strand(subTrack) <- "-"
chromosome(arTrack)
chromosome(subTrack) <- "chrX"
genome(arTrack)
genome(subTrack) <- "mm9"
range(arTrack)
ranges(arTrack)
coverage(arTrack)
## Annotation
values(arTrack)
## Stacking
stacking(arTrack)
stacking(arTrack) <- "dense"
## coercion
as(arTrack, "data.frame")
Results
R version 3.3.1 (2016-06-21) -- "Bug in Your Hair"
Copyright (C) 2016 The R Foundation for Statistical Computing
Platform: x86_64-pc-linux-gnu (64-bit)

R is free software and comes with ABSOLUTELY NO WARRANTY.
You are welcome to redistribute it under certain conditions.
Type 'license()' or 'licence()' for distribution details.

R is a collaborative project with many contributors.
Type 'contributors()' for more information and
'citation()' on how to cite R or R packages in publications.

Type 'demo()' for some demos, 'help()' for on-line help, or
'help.start()' for an HTML browser interface to help.
Type 'q()' to quit R.

> library(Gviz)
Loading required package: S4Vectors
Loading required package: stats4
Loading required package: BiocGenerics
Loading required package: parallel

Attaching package: 'BiocGenerics'

The following objects are masked from 'package:parallel':

    clusterApply, clusterApplyLB, clusterCall, clusterEvalQ,
    clusterExport, clusterMap, parApply, parCapply, parLapply,
    parLapplyLB, parRapply, parSapply, parSapplyLB

The following objects are masked from 'package:stats':

    IQR, mad, xtabs

The following objects are masked from 'package:base':

    Filter, Find, Map, Position, Reduce, anyDuplicated, append,
    as.data.frame, cbind, colnames, do.call, duplicated, eval, evalq,
    get, grep, grepl, intersect, is.unsorted, lapply, lengths, mapply,
    match, mget, order, paste, pmax, pmax.int, pmin, pmin.int, rank,
    rbind, rownames, sapply, setdiff, sort, table, tapply, union,
    unique, unsplit


Attaching package: 'S4Vectors'

The following objects are masked from 'package:base':

    colMeans, colSums, expand.grid, rowMeans, rowSums

Loading required package: IRanges
Loading required package: GenomicRanges
Loading required package: GenomeInfoDb
Loading required package: grid
> png(filename="/home/ddbj/snapshot/RGM3/R_BC/result/Gviz/AlignedReadTrack-class.Rd_%03d_medium.png", width=480, height=480)
> ### Name: AlignedReadTrack-class
> ### Title: AlignedReadTrack class and methods (NOTE: THIS IS STILL IN
> ###   DEVELOPMENT AND SUBJECT TO CHANGE)
> ### Aliases: AlignedReadTrack-class AlignedReadTrack
> ###   [,AlignedReadTrack-method [,AlignedReadTrack,ANY,ANY-method
> ###   coverage,AlignedReadTrack-method drawAxis,AlignedReadTrack-method
> ###   drawGD,AlignedReadTrack-method drawGrid,AlignedReadTrack-method
> ###   initialize,AlignedReadTrack-method
> ###   setCoverage,AlignedReadTrack-method show,AlignedReadTrack-method
> ###   split,AlignedReadTrack,ANY-method split,AlignedReadTrack-method
> ###   subset,AlignedReadTrack-method
> ### Keywords: classes
>
> ### ** Examples
>
>
> ## Construct from individual arguments
> arTrack <- AlignedReadTrack(start=runif(1000, 100, 200), width=24,
+ genome="mm9", chromosome=7, strand=sample(c("+", "-"), 1000, TRUE))
>
> ## Don't show:
> ## For some annoying reason the postscript device does not know about
> ## the sans font
> #if(!interactive())
> #{
> font <- ps.options()$family
> displayPars(arTrack) <- list(fontfamily=font, fontfamily.title=font)
> #}
> ## End(Don't show)
>
> ## Plotting
> plotTracks(arTrack)
>
> ## Track names
> names(arTrack)
[1] "AlignedReadTrack"
> names(arTrack) <- "foo"
> plotTracks(arTrack)
>
> ## Subsetting and splitting
> subTrack <- subset(arTrack, from=110, to=130)
> length(subTrack)
[1] 319
> subTrack[1:2]
AlignedRead track 'foo' containing 2 reads all mapping to chromosome 7 of the mm9 genome:

GRanges object with 2 ranges and 0 metadata columns:
      seqnames     ranges strand
         <Rle>  <IRanges>  <Rle>
  [1]     chr7 [161, 185]      -
  [2]     chr7 [105, 129]      -
  -------
  seqinfo: 1 sequence from mm9 genome; no seqlengths
> split(arTrack, strand(arTrack))
$`+`
AlignedRead track 'foo' containing 488 reads all mapping to chromosome 7 of the mm9 genome:

GRanges object with 488 ranges and 0 metadata columns:
        seqnames     ranges strand
           <Rle>  <IRanges>  <Rle>
    [1]     chr7 [131, 155]      +
    [2]     chr7 [168, 192]      +
    [3]     chr7 [182, 206]      +
    [4]     chr7 [183, 207]      +
    [5]     chr7 [110, 134]      +
    ...      ...        ...    ...
  [484]     chr7 [152, 176]      +
  [485]     chr7 [189, 213]      +
  [486]     chr7 [139, 163]      +
  [487]     chr7 [114, 138]      +
  [488]     chr7 [167, 191]      +
  -------
  seqinfo: 1 sequence from mm9 genome; no seqlengths

$`-`
AlignedRead track 'foo' containing 512 reads all mapping to chromosome 7 of the mm9 genome:

GRanges object with 512 ranges and 0 metadata columns:
        seqnames     ranges strand
           <Rle>  <IRanges>  <Rle>
    [1]     chr7 [161, 185]      -
    [2]     chr7 [105, 129]      -
    [3]     chr7 [125, 149]      -
    [4]     chr7 [154, 178]      -
    [5]     chr7 [181, 205]      -
    ...      ...        ...    ...
  [508]     chr7 [114, 138]      -
  [509]     chr7 [148, 172]      -
  [510]     chr7 [186, 210]      -
  [511]     chr7 [122, 146]      -
  [512]     chr7 [161, 185]      -
  -------
  seqinfo: 1 sequence from mm9 genome; no seqlengths

>
> ## Accessors
> start(arTrack)
   [1] 131 161 105 168 182 125 183 154 181 173 171 110 110 193 136 164 130 114
  [19] 162 123 173 131 117 175 116 140 174 108 189 105 104 147 196 138 176 128
  [37] 104 198 140 121 143 140 116 112 112 117 174 167 168 196 160 182 189 109
  [55] 172 171 169 162 165 182 124 105 161 196 128 142 193 144 182 114 143 194
  [73] 121 166 186 168 108 183 194 199 197 156 105 122 156 103 182 103 134 177
  [91] 107 172 118 164 115 108 106 107 143 101 106 153 152 181 103 125 169 137
 [109] 153 135 140 178 183 104 102 144 195 134 116 113 112 167 159 115 157 189
 [127] 178 142 167 168 116 137 186 151 183 108 191 107 180 112 103 131 178 155
 [145] 166 187 167 110 171 151 124 131 176 104 178 151 100 131 141 198 197 183
 [163] 144 178 111 154 182 102 143 157 183 171 146 128 138 101 192 117 108 130
 [181] 124 125 174 198 117 102 157 126 184 183 147 139 186 196 181 113 161 139
 [199] 175 155 124 105 177 114 176 191 193 143 156 104 123 159 140 112 178 122
 [217] 157 105 151 130 163 194 125 132 159 175 117 137 142 131 173 182 168 192
 [235] 103 103 198 190 119 147 191 197 112 190 144 149 136 169 182 183 188 155
 [253] 119 124 133 153 153 179 136 193 153 109 137 101 104 136 103 191 107 168
 [271] 109 152 103 105 101 155 147 144 116 147 120 167 122 168 188 184 172 111
 [289] 114 143 136 168 140 114 193 181 172 119 106 169 196 156 174 121 182 125
 [307] 190 122 127 149 131 105 167 131 189 106 108 156 139 172 142 151 188 157
 [325] 167 159 195 146 184 192 109 141 104 165 137 156 156 147 161 116 196 190
 [343] 189 113 127 106 172 185 101 128 177 158 139 197 134 103 161 131 151 141
 [361] 171 175 178 111 189 199 145 142 116 170 144 196 101 150 108 121 101 111
 [379] 190 143 198 176 108 196 129 189 122 155 171 173 119 126 187 182 198 146
 [397] 116 163 190 120 195 112 124 101 131 145 181 191 127 100 122 147 168 182
 [415] 127 188 101 182 160 192 199 142 181 199 138 120 152 121 100 141 139 140
 [433] 111 156 123 167 188 115 155 191 191 111 172 189 100 198 133 184 188 140
 [451] 194 147 124 128 126 104 172 144 159 117 192 155 191 128 182 174 197 188
 [469] 138 199 167 136 179 192 156 144 164 156 190 119 166 122 177 191 195 108
 [487] 138 108 130 185 141 173 148 152 193 182 126 180 120 196 129 177 177 188
 [505] 131 176 162 129 130 182 153 122 186 105 178 117 150 149 124 181 144 168
 [523] 178 150 187 192 177 155 129 179 102 191 148 114 164 130 142 174 145 168
 [541] 177 143 134 102 168 145 172 112 152 104 151 151 113 101 124 190 181 137
 [559] 142 105 170 150 101 149 115 167 129 141 190 109 159 132 118 189 105 147
 [577] 114 140 148 113 112 119 114 138 185 162 106 129 103 167 182 146 114 118
 [595] 117 183 103 180 179 131 131 116 124 123 195 108 149 170 150 166 165 130
 [613] 129 182 112 135 192 163 137 126 145 154 197 161 167 199 147 135 165 147
 [631] 123 189 134 106 170 186 140 169 124 155 105 168 139 120 171 125 116 176
 [649] 183 134 141 177 104 143 155 102 141 184 136 128 107 121 184 188 116 179
 [667] 135 100 189 176 151 127 129 154 114 162 192 173 114 181 181 169 116 183
 [685] 106 144 152 151 147 119 137 161 154 136 157 179 161 166 149 126 191 128
 [703] 172 145 120 161 145 104 135 174 141 153 142 115 117 120 118 108 152 116
 [721] 172 167 159 103 189 171 178 104 122 107 143 159 171 122 119 128 117 145
 [739] 186 133 152 174 139 136 150 141 156 181 180 133 102 197 161 144 128 141
 [757] 117 148 184 192 140 108 145 124 151 151 101 163 116 116 157 184 101 179
 [775] 121 183 170 143 137 160 116 168 169 161 148 100 198 165 117 193 128 173
 [793] 161 158 132 115 138 106 165 162 185 173 120 163 112 171 121 123 147 151
 [811] 192 100 183 125 187 198 190 118 124 109 148 127 167 178 181 143 132 168
 [829] 173 175 104 181 148 141 105 165 195 197 197 109 115 126 152 130 167 141
 [847] 167 171 120 113 156 124 111 192 147 121 147 190 110 132 124 196 195 118
 [865] 174 195 179 152 174 112 144 148 155 198 135 180 166 128 171 158 164 134
 [883] 148 196 117 170 108 145 164 106 113 111 134 185 125 174 179 129 114 173
 [901] 134 142 166 114 171 132 134 113 166 148 103 143 159 122 117 103 123 158
 [919] 191 144 153 168 133 148 106 168 154 173 197 117 184 165 109 167 189 166
 [937] 192 147 176 193 185 121 143 114 165 141 124 178 151 145 145 170 145 196
 [955] 177 190 112 112 176 141 192 142 124 122 177 108 169 146 184 175 171 156
 [973] 132 166 121 142 163 171 106 148 141 145 123 187 164 146 114 148 179 137
 [991] 186 148 122 156 152 189 139 161 114 167
> end(arTrack)
   [1] 155 185 129 192 206 149 207 178 205 197 195 134 134 217 160 188 154 138
  [19] 186 147 197 155 141 199 140 164 198 132 213 129 128 171 220 162 200 152
  [37] 128 222 164 145 167 164 140 136 136 141 198 191 192 220 184 206 213 133
  [55] 196 195 193 186 189 206 148 129 185 220 152 166 217 168 206 138 167 218
  [73] 145 190 210 192 132 207 218 223 221 180 129 146 180 127 206 127 158 201
  [91] 131 196 142 188 139 132 130 131 167 125 130 177 176 205 127 149 193 161
 [109] 177 159 164 202 207 128 126 168 219 158 140 137 136 191 183 139 181 213
 [127] 202 166 191 192 140 161 210 175 207 132 215 131 204 136 127 155 202 179
 [145] 190 211 191 134 195 175 148 155 200 128 202 175 124 155 165 222 221 207
 [163] 168 202 135 178 206 126 167 181 207 195 170 152 162 125 216 141 132 154
 [181] 148 149 198 222 141 126 181 150 208 207 171 163 210 220 205 137 185 163
 [199] 199 179 148 129 201 138 200 215 217 167 180 128 147 183 164 136 202 146
 [217] 181 129 175 154 187 218 149 156 183 199 141 161 166 155 197 206 192 216
 [235] 127 127 222 214 143 171 215 221 136 214 168 173 160 193 206 207 212 179
 [253] 143 148 157 177 177 203 160 217 177 133 161 125 128 160 127 215 131 192
 [271] 133 176 127 129 125 179 171 168 140 171 144 191 146 192 212 208 196 135
 [289] 138 167 160 192 164 138 217 205 196 143 130 193 220 180 198 145 206 149
 [307] 214 146 151 173 155 129 191 155 213 130 132 180 163 196 166 175 212 181
 [325] 191 183 219 170 208 216 133 165 128 189 161 180 180 171 185 140 220 214
 [343] 213 137 151 130 196 209 125 152 201 182 163 221 158 127 185 155 175 165
 [361] 195 199 202 135 213 223 169 166 140 194 168 220 125 174 132 145 125 135
 [379] 214 167 222 200 132 220 153 213 146 179 195 197 143 150 211 206 222 170
 [397] 140 187 214 144 219 136 148 125 155 169 205 215 151 124 146 171 192 206
 [415] 151 212 125 206 184 216 223 166 205 223 162 144 176 145 124 165 163 164
 [433] 135 180 147 191 212 139 179 215 215 135 196 213 124 222 157 208 212 164
 [451] 218 171 148 152 150 128 196 168 183 141 216 179 215 152 206 198 221 212
 [469] 162 223 191 160 203 216 180 168 188 180 214 143 190 146 201 215 219 132
 [487] 162 132 154 209 165 197 172 176 217 206 150 204 144 220 153 201 201 212
 [505] 155 200 186 153 154 206 177 146 210 129 202 141 174 173 148 205 168 192
 [523] 202 174 211 216 201 179 153 203 126 215 172 138 188 154 166 198 169 192
 [541] 201 167 158 126 192 169 196 136 176 128 175 175 137 125 148 214 205 161
 [559] 166 129 194 174 125 173 139 191 153 165 214 133 183 156 142 213 129 171
 [577] 138 164 172 137 136 143 138 162 209 186 130 153 127 191 206 170 138 142
 [595] 141 207 127 204 203 155 155 140 148 147 219 132 173 194 174 190 189 154
 [613] 153 206 136 159 216 187 161 150 169 178 221 185 191 223 171 159 189 171
 [631] 147 213 158 130 194 210 164 193 148 179 129 192 163 144 195 149 140 200
 [649] 207 158 165 201 128 167 179 126 165 208 160 152 131 145 208 212 140 203
 [667] 159 124 213 200 175 151 153 178 138 186 216 197 138 205 205 193 140 207
 [685] 130 168 176 175 171 143 161 185 178 160 181 203 185 190 173 150 215 152
 [703] 196 169 144 185 169 128 159 198 165 177 166 139 141 144 142 132 176 140
 [721] 196 191 183 127 213 195 202 128 146 131 167 183 195 146 143 152 141 169
 [739] 210 157 176 198 163 160 174 165 180 205 204 157 126 221 185 168 152 165
 [757] 141 172 208 216 164 132 169 148 175 175 125 187 140 140 181 208 125 203
 [775] 145 207 194 167 161 184 140 192 193 185 172 124 222 189 141 217 152 197
 [793] 185 182 156 139 162 130 189 186 209 197 144 187 136 195 145 147 171 175
 [811] 216 124 207 149 211 222 214 142 148 133 172 151 191 202 205 167 156 192
 [829] 197 199 128 205 172 165 129 189 219 221 221 133 139 150 176 154 191 165
 [847] 191 195 144 137 180 148 135 216 171 145 171 214 134 156 148 220 219 142
 [865] 198 219 203 176 198 136 168 172 179 222 159 204 190 152 195 182 188 158
 [883] 172 220 141 194 132 169 188 130 137 135 158 209 149 198 203 153 138 197
 [901] 158 166 190 138 195 156 158 137 190 172 127 167 183 146 141 127 147 182
 [919] 215 168 177 192 157 172 130 192 178 197 221 141 208 189 133 191 213 190
 [937] 216 171 200 217 209 145 167 138 189 165 148 202 175 169 169 194 169 220
 [955] 201 214 136 136 200 165 216 166 148 146 201 132 193 170 208 199 195 180
 [973] 156 190 145 166 187 195 130 172 165 169 147 211 188 170 138 172 203 161
 [991] 210 172 146 180 176 213 163 185 138 191
> width(arTrack)
   [1] 25 25 25 25 25 25 25 25 25 25 25 25 25 25 25 25 25 25 25 25 25 25 25 25
  [25] 25 25 25 25 25 25 25 25 25 25 25 25 25 25 25 25 25 25 25 25 25 25 25 25
  [49] 25 25 25 25 25 25 25 25 25 25 25 25 25 25 25 25 25 25 25 25 25 25 25 25
  [73] 25 25 25 25 25 25 25 25 25 25 25 25 25 25 25 25 25 25 25 25 25 25 25 25
  [97] 25 25 25 25 25 25 25 25 25 25 25 25 25 25 25 25 25 25 25 25 25 25 25 25
 [121] 25 25 25 25 25 25 25 25 25 25 25 25 25 25 25 25 25 25 25 25 25 25 25 25
 [145] 25 25 25 25 25 25 25 25 25 25 25 25 25 25 25 25 25 25 25 25 25 25 25 25
 [169] 25 25 25 25 25 25 25 25 25 25 25 25 25 25 25 25 25 25 25 25 25 25 25 25
 [193] 25 25 25 25 25 25 25 25 25 25 25 25 25 25 25 25 25 25 25 25 25 25 25 25
 [217] 25 25 25 25 25 25 25 25 25 25 25 25 25 25 25 25 25 25 25 25 25 25 25 25
 [241] 25 25 25 25 25 25 25 25 25 25 25 25 25 25 25 25 25 25 25 25 25 25 25 25
 [265] 25 25 25 25 25 25 25 25 25 25 25 25 25 25 25 25 25 25 25 25 25 25 25 25
 [289] 25 25 25 25 25 25 25 25 25 25 25 25 25 25 25 25 25 25 25 25 25 25 25 25
 [313] 25 25 25 25 25 25 25 25 25 25 25 25 25 25 25 25 25 25 25 25 25 25 25 25
 [337] 25 25 25 25 25 25 25 25 25 25 25 25 25 25 25 25 25 25 25 25 25 25 25 25
 [361] 25 25 25 25 25 25 25 25 25 25 25 25 25 25 25 25 25 25 25 25 25 25 25 25
 [385] 25 25 25 25 25 25 25 25 25 25 25 25 25 25 25 25 25 25 25 25 25 25 25 25
 [409] 25 25 25 25 25 25 25 25 25 25 25 25 25 25 25 25 25 25 25 25 25 25 25 25
 [433] 25 25 25 25 25 25 25 25 25 25 25 25 25 25 25 25 25 25 25 25 25 25 25 25
 [457] 25 25 25 25 25 25 25 25 25 25 25 25 25 25 25 25 25 25 25 25 25 25 25 25
 [481] 25 25 25 25 25 25 25 25 25 25 25 25 25 25 25 25 25 25 25 25 25 25 25 25
 [505] 25 25 25 25 25 25 25 25 25 25 25 25 25 25 25 25 25 25 25 25 25 25 25 25
 [529] 25 25 25 25 25 25 25 25 25 25 25 25 25 25 25 25 25 25 25 25 25 25 25 25
 [553] 25 25 25 25 25 25 25 25 25 25 25 25 25 25 25 25 25 25 25 25 25 25 25 25
 [577] 25 25 25 25 25 25 25 25 25 25 25 25 25 25 25 25 25 25 25 25 25 25 25 25
 [601] 25 25 25 25 25 25 25 25 25 25 25 25 25 25 25 25 25 25 25 25 25 25 25 25
 [625] 25 25 25 25 25 25 25 25 25 25 25 25 25 25 25 25 25 25 25 25 25 25 25 25
 [649] 25 25 25 25 25 25 25 25 25 25 25 25 25 25 25 25 25 25 25 25 25 25 25 25
 [673] 25 25 25 25 25 25 25 25 25 25 25 25 25 25 25 25 25 25 25 25 25 25 25 25
 [697] 25 25 25 25 25 25 25 25 25 25 25 25 25 25 25 25 25 25 25 25 25 25 25 25
 [721] 25 25 25 25 25 25 25 25 25 25 25 25 25 25 25 25 25 25 25 25 25 25 25 25
 [745] 25 25 25 25 25 25 25 25 25 25 25 25 25 25 25 25 25 25 25 25 25 25 25 25
 [769] 25 25 25 25 25 25 25 25 25 25 25 25 25 25 25 25 25 25 25 25 25 25 25 25
 [793] 25 25 25 25 25 25 25 25 25 25 25 25 25 25 25 25 25 25 25 25 25 25 25 25
 [817] 25 25 25 25 25 25 25 25 25 25 25 25 25 25 25 25 25 25 25 25 25 25 25 25
 [841] 25 25 25 25 25 25 25 25 25 25 25 25 25 25 25 25 25 25 25 25 25 25 25 25
 [865] 25 25 25 25 25 25 25 25 25 25 25 25 25 25 25 25 25 25 25 25 25 25 25 25
 [889] 25 25 25 25 25 25 25 25 25 25 25 25 25 25 25 25 25 25 25 25 25 25 25 25
 [913] 25 25 25 25 25 25 25 25 25 25 25 25 25 25 25 25 25 25 25 25 25 25 25 25
 [937] 25 25 25 25 25 25 25 25 25 25 25 25 25 25 25 25 25 25 25 25 25 25 25 25
 [961] 25 25 25 25 25 25 25 25 25 25 25 25 25 25 25 25 25 25 25 25 25 25 25 25
 [985] 25 25 25 25 25 25 25 25 25 25 25 25 25 25 25 25
> position(arTrack)
   [1] 143 173 117 180 194 137 195 166 193 185 183 122 122 205 148 176 142 126
  [19] 174 135 185 143 129 187 128 152 186 120 201 117 116 159 208 150 188 140
  [37] 116 210 152 133 155 152 128 124 124 129 186 179 180 208 172 194 201 121
  [55] 184 183 181 174 177 194 136 117 173 208 140 154 205 156 194 126 155 206
  [73] 133 178 198 180 120 195 206 211 209 168 117 134 168 115 194 115 146 189
  [91] 119 184 130 176 127 120 118 119 155 113 118 165 164 193 115 137 181 149
 [109] 165 147 152 190 195 116 114 156 207 146 128 125 124 179 171 127 169 201
 [127] 190 154 179 180 128 149 198 163 195 120 203 119 192 124 115 143 190 167
 [145] 178 199 179 122 183 163 136 143 188 116 190 163 112 143 153 210 209 195
 [163] 156 190 123 166 194 114 155 169 195 183 158 140 150 113 204 129 120 142
 [181] 136 137 186 210 129 114 169 138 196 195 159 151 198 208 193 125 173 151
 [199] 187 167 136 117 189 126 188 203 205 155 168 116 135 171 152 124 190 134
 [217] 169 117 163 142 175 206 137 144 171 187 129 149 154 143 185 194 180 204
 [235] 115 115 210 202 131 159 203 209 124 202 156 161 148 181 194 195 200 167
 [253] 131 136 145 165 165 191 148 205 165 121 149 113 116 148 115 203 119 180
 [271] 121 164 115 117 113 167 159 156 128 159 132 179 134 180 200 196 184 123
 [289] 126 155 148 180 152 126 205 193 184 131 118 181 208 168 186 133 194 137
 [307] 202 134 139 161 143 117 179 143 201 118 120 168 151 184 154 163 200 169
 [325] 179 171 207 158 196 204 121 153 116 177 149 168 168 159 173 128 208 202
 [343] 201 125 139 118 184 197 113 140 189 170 151 209 146 115 173 143 163 153
 [361] 183 187 190 123 201 211 157 154 128 182 156 208 113 162 120 133 113 123
 [379] 202 155 210 188 120 208 141 201 134 167 183 185 131 138 199 194 210 158
 [397] 128 175 202 132 207 124 136 113 143 157 193 203 139 112 134 159 180 194
 [415] 139 200 113 194 172 204 211 154 193 211 150 132 164 133 112 153 151 152
 [433] 123 168 135 179 200 127 167 203 203 123 184 201 112 210 145 196 200 152
 [451] 206 159 136 140 138 116 184 156 171 129 204 167 203 140 194 186 209 200
 [469] 150 211 179 148 191 204 168 156 176 168 202 131 178 134 189 203 207 120
 [487] 150 120 142 197 153 185 160 164 205 194 138 192 132 208 141 189 189 200
 [505] 143 188 174 141 142 194 165 134 198 117 190 129 162 161 136 193 156 180
 [523] 190 162 199 204 189 167 141 191 114 203 160 126 176 142 154 186 157 180
 [541] 189 155 146 114 180 157 184 124 164 116 163 163 125 113 136 202 193 149
 [559] 154 117 182 162 113 161 127 179 141 153 202 121 171 144 130 201 117 159
 [577] 126 152 160 125 124 131 126 150 197 174 118 141 115 179 194 158 126 130
 [595] 129 195 115 192 191 143 143 128 136 135 207 120 161 182 162 178 177 142
 [613] 141 194 124 147 204 175 149 138 157 166 209 173 179 211 159 147 177 159
 [631] 135 201 146 118 182 198 152 181 136 167 117 180 151 132 183 137 128 188
 [649] 195 146 153 189 116 155 167 114 153 196 148 140 119 133 196 200 128 191
 [667] 147 112 201 188 163 139 141 166 126 174 204 185 126 193 193 181 128 195
 [685] 118 156 164 163 159 131 149 173 166 148 169 191 173 178 161 138 203 140
 [703] 184 157 132 173 157 116 147 186 153 165 154 127 129 132 130 120 164 128
 [721] 184 179 171 115 201 183 190 116 134 119 155 171 183 134 131 140 129 157
 [739] 198 145 164 186 151 148 162 153 168 193 192 145 114 209 173 156 140 153
 [757] 129 160 196 204 152 120 157 136 163 163 113 175 128 128 169 196 113 191
 [775] 133 195 182 155 149 172 128 180 181 173 160 112 210 177 129 205 140 185
 [793] 173 170 144 127 150 118 177 174 197 185 132 175 124 183 133 135 159 163
 [811] 204 112 195 137 199 210 202 130 136 121 160 139 179 190 193 155 144 180
 [829] 185 187 116 193 160 153 117 177 207 209 209 121 127 138 164 142 179 153
 [847] 179 183 132 125 168 136 123 204 159 133 159 202 122 144 136 208 207 130
 [865] 186 207 191 164 186 124 156 160 167 210 147 192 178 140 183 170 176 146
 [883] 160 208 129 182 120 157 176 118 125 123 146 197 137 186 191 141 126 185
 [901] 146 154 178 126 183 144 146 125 178 160 115 155 171 134 129 115 135 170
 [919] 203 156 165 180 145 160 118 180 166 185 209 129 196 177 121 179 201 178
 [937] 204 159 188 205 197 133 155 126 177 153 136 190 163 157 157 182 157 208
 [955] 189 202 124 124 188 153 204 154 136 134 189 120 181 158 196 187 183 168
 [973] 144 178 133 154 175 183 118 160 153 157 135 199 176 158 126 160 191 149
 [991] 198 160 134 168 164 201 151 173 126 179
> width(subTrack) <- 30
>
> strand(arTrack)
   [1] "+" "-" "-" "+" "+" "-" "+" "-" "-" "-" "-" "+" "-" "+" "-" "-" "-" "+"
  [19] "+" "-" "-" "-" "-" "+" "+" "-" "+" "-" "-" "-" "-" "+" "+" "+" "-" "-"
  [37] "-" "+" "+" "+" "-" "-" "-" "+" "+" "-" "-" "-" "-" "+" "+" "+" "+" "-"
  [55] "+" "-" "+" "-" "-" "+" "-" "-" "+" "-" "-" "+" "+" "+" "-" "-" "+" "+"
  [73] "-" "+" "-" "-" "+" "-" "-" "+" "-" "-" "-" "+" "-" "+" "-" "-" "+" "+"
  [91] "-" "-" "+" "+" "-" "+" "-" "-" "+" "+" "+" "+" "-" "+" "-" "-" "+" "+"
 [109] "-" "-" "+" "+" "+" "-" "-" "+" "-" "-" "+" "+" "+" "-" "+" "-" "-" "+"
 [127] "+" "+" "-" "-" "-" "+" "-" "+" "+" "+" "+" "+" "+" "-" "-" "-" "+" "-"
 [145] "-" "+" "-" "-" "+" "-" "+" "-" "-" "+" "+" "+" "+" "-" "+" "+" "-" "-"
 [163] "-" "-" "+" "-" "-" "+" "+" "-" "+" "+" "-" "+" "+" "-" "-" "+" "+" "-"
 [181] "-" "-" "+" "-" "-" "-" "+" "-" "-" "+" "+" "-" "+" "+" "-" "+" "-" "+"
 [199] "-" "+" "+" "-" "-" "+" "+" "-" "-" "-" "+" "+" "-" "-" "+" "-" "+" "+"
 [217] "+" "+" "+" "+" "+" "+" "+" "-" "+" "+" "-" "-" "+" "+" "+" "-" "-" "-"
 [235] "-" "+" "+" "+" "-" "+" "-" "+" "+" "+" "+" "-" "+" "-" "-" "+" "-" "-"
 [253] "+" "-" "+" "-" "-" "-" "-" "-" "-" "+" "-" "+" "-" "-" "+" "+" "+" "+"
 [271] "+" "-" "+" "-" "-" "-" "+" "+" "+" "+" "+" "+" "-" "+" "-" "+" "-" "+"
 [289] "+" "-" "-" "-" "-" "+" "-" "-" "-" "-" "+" "-" "+" "+" "+" "-" "-" "+"
 [307] "+" "+" "-" "+" "-" "+" "+" "-" "+" "-" "+" "-" "+" "+" "+" "+" "+" "+"
 [325] "-" "-" "-" "+" "-" "+" "+" "+" "+" "+" "-" "-" "+" "-" "-" "-" "-" "-"
 [343] "+" "+" "-" "+" "-" "-" "-" "+" "+" "-" "-" "-" "-" "+" "-" "-" "-" "+"
 [361] "-" "-" "+" "+" "-" "-" "+" "-" "-" "-" "-" "+" "-" "+" "+" "+" "-" "+"
 [379] "+" "+" "+" "-" "-" "+" "-" "-" "-" "-" "-" "-" "-" "+" "-" "+" "-" "-"
 [397] "-" "+" "-" "-" "+" "-" "-" "-" "-" "+" "+" "+" "-" "+" "+" "+" "-" "-"
 [415] "+" "-" "-" "-" "+" "-" "+" "+" "+" "+" "-" "-" "+" "+" "-" "-" "+" "-"
 [433] "+" "-" "-" "+" "+" "+" "-" "-" "+" "+" "+" "-" "+" "+" "+" "+" "-" "-"
 [451] "-" "-" "-" "+" "+" "+" "+" "+" "-" "-" "-" "+" "+" "-" "-" "-" "+" "+"
 [469] "+" "+" "+" "-" "+" "-" "+" "-" "-" "+" "+" "+" "+" "-" "-" "+" "+" "+"
 [487] "+" "+" "+" "-" "-" "-" "-" "-" "+" "+" "-" "-" "+" "-" "+" "-" "-" "+"
 [505] "-" "+" "+" "+" "-" "+" "+" "-" "-" "-" "-" "-" "+" "+" "+" "-" "-" "-"
 [523] "+" "-" "+" "+" "+" "-" "-" "-" "-" "+" "-" "+" "-" "+" "-" "+" "-" "+"
 [541] "+" "-" "-" "+" "-" "+" "+" "-" "-" "-" "+" "-" "-" "-" "+" "-" "+" "-"
 [559] "-" "-" "+" "+" "-" "+" "-" "-" "-" "+" "+" "+" "-" "-" "-" "-" "-" "+"
 [577] "-" "-" "-" "+" "-" "+" "-" "+" "-" "+" "-" "-" "+" "-" "+" "-" "-" "+"
 [595] "-" "-" "-" "-" "+" "-" "+" "-" "+" "+" "-" "-" "+" "-" "+" "-" "-" "-"
 [613] "+" "-" "-" "+" "+" "-" "+" "-" "+" "+" "+" "-" "+" "+" "-" "-" "+" "+"
 [631] "+" "+" "-" "-" "+" "-" "+" "-" "+" "+" "+" "-" "-" "-" "-" "-" "+" "-"
 [649] "+" "-" "-" "+" "+" "-" "-" "+" "-" "-" "+" "-" "+" "+" "-" "-" "-" "+"
 [667] "+" "+" "-" "-" "-" "-" "+" "-" "+" "-" "+" "-" "+" "-" "+" "-" "-" "-"
 [685] "+" "+" "-" "+" "+" "-" "-" "-" "+" "-" "-" "-" "+" "+" "-" "+" "-" "+"
 [703] "-" "+" "+" "-" "-" "+" "+" "-" "+" "-" "-" "+" "-" "-" "-" "+" "-" "+"
 [721] "+" "+" "+" "+" "+" "+" "+" "-" "-" "+" "+" "-" "-" "+" "-" "-" "+" "-"
 [739] "+" "+" "+" "+" "+" "-" "-" "-" "+" "-" "-" "+" "-" "+" "+" "+" "-" "-"
 [757] "-" "+" "+" "+" "-" "-" "-" "+" "+" "+" "+" "+" "+" "-" "-" "+" "-" "-"
 [775] "-" "+" "+" "+" "-" "+" "-" "-" "+" "-" "-" "+" "+" "-" "-" "+" "-" "+"
 [793] "-" "+" "+" "-" "-" "+" "-" "-" "-" "-" "-" "-" "+" "-" "+" "+" "+" "+"
 [811] "+" "-" "+" "+" "+" "-" "+" "-" "-" "-" "-" "+" "+" "+" "-" "-" "+" "-"
 [829] "-" "-" "+" "+" "-" "+" "+" "-" "-" "-" "-" "-" "+" "+" "+" "+" "-" "+"
 [847] "-" "+" "+" "+" "+" "+" "-" "+" "+" "-" "-" "-" "+" "-" "+" "+" "+" "-"
 [865] "-" "+" "-" "-" "-" "+" "+" "-" "+" "-" "-" "+" "-" "+" "-" "+" "-" "+"
 [883] "-" "+" "-" "-" "-" "+" "+" "-" "-" "+" "+" "-" "+" "+" "-" "+" "+" "+"
 [901] "-" "-" "+" "-" "-" "+" "-" "+" "+" "-" "-" "+" "-" "+" "-" "-" "-" "+"
 [919] "-" "+" "-" "+" "-" "+" "-" "+" "+" "+" "+" "-" "-" "-" "-" "+" "-" "+"
 [937] "+" "-" "-" "+" "+" "+" "+" "-" "-" "-" "+" "-" "-" "+" "+" "-" "+" "+"
 [955] "+" "-" "-" "+" "+" "-" "+" "-" "-" "+" "+" "+" "+" "+" "+" "-" "-" "+"
 [973] "-" "-" "-" "-" "-" "-" "-" "-" "+" "-" "-" "+" "+" "-" "-" "-" "+" "+"
 [991] "-" "+" "-" "+" "+" "+" "+" "-" "+" "+"
> strand(subTrack) <- "-"
>
> chromosome(arTrack)
[1] "chr7"
> chromosome(subTrack) <- "chrX"
>
> genome(arTrack)
 chr7
"mm9"
> genome(subTrack) <- "mm9"
>
> range(arTrack)
IRanges object with 1000 ranges and 0 metadata columns:
             start       end     width
         <integer> <integer> <integer>
     [1]       131       155        25
     [2]       161       185        25
     [3]       105       129        25
     [4]       168       192        25
     [5]       182       206        25
     ...       ...       ...       ...
   [996]       189       213        25
   [997]       139       163        25
   [998]       161       185        25
   [999]       114       138        25
  [1000]       167       191        25
> ranges(arTrack)
GRanges object with 1000 ranges and 0 metadata columns:
         seqnames     ranges strand
            <Rle>  <IRanges>  <Rle>
     [1]     chr7 [131, 155]      +
     [2]     chr7 [161, 185]      -
     [3]     chr7 [105, 129]      -
     [4]     chr7 [168, 192]      +
     [5]     chr7 [182, 206]      +
     ...      ...        ...    ...
   [996]     chr7 [189, 213]      +
   [997]     chr7 [139, 163]      +
   [998]     chr7 [161, 185]      -
   [999]     chr7 [114, 138]      +
  [1000]     chr7 [167, 191]      +
  -------
  seqinfo: 1 sequence from mm9 genome; no seqlengths
>
> coverage(arTrack)
integer-Rle of length 223 with 121 runs
  Lengths:  99   1   1   1   1   1   1   1 ...   1   1   1   1   1   1   1   1
  Values :   0   7  20  27  41  54  67  79 ...  72  58  50  46  38  26  16   6
>
> ## Annotation
> values(arTrack)
data frame with 0 columns and 1000 rows
>
> ## Stacking
> stacking(arTrack)
[1] "squish"
> stacking(arTrack) <- "dense"
>
> ## coercion
> as(arTrack, "data.frame")
     X.seqnames X.start X.end X.width X.strand
1          chr7     131   155      25        +
2          chr7     161   185      25        -
3          chr7     105   129      25        -
4          chr7     168   192      25        +
5          chr7     182   206      25        +
6          chr7     125   149      25        -
7          chr7     183   207      25        +
8          chr7     154   178      25        -
9          chr7     181   205      25        -
10         chr7     173   197      25        -
11         chr7     171   195      25        -
12         chr7     110   134      25        +
13         chr7     110   134      25        -
14         chr7     193   217      25        +
15         chr7     136   160      25        -
16         chr7     164   188      25        -
17         chr7     130   154      25        -
18         chr7     114   138      25        +
19         chr7     162   186      25        +
20         chr7     123   147      25        -
21         chr7     173   197      25        -
22         chr7     131   155      25        -
23         chr7     117   141      25        -
24         chr7     175   199      25        +
25         chr7     116   140      25        +
26         chr7     140   164      25        -
27         chr7     174   198      25        +
28         chr7     108   132      25        -
29         chr7     189   213      25        -
30         chr7     105   129      25        -
31         chr7     104   128      25        -
32         chr7     147   171      25        +
33         chr7     196   220      25        +
34         chr7     138   162      25        +
35         chr7     176   200      25        -
36         chr7     128   152      25        -
37         chr7     104   128      25        -
38         chr7     198   222      25        +
39         chr7     140   164      25        +
40         chr7     121   145      25        +
41         chr7     143   167      25        -
42         chr7     140   164      25        -
43         chr7     116   140      25        -
44         chr7     112   136      25        +
45         chr7     1
|