A class to represent short sequences that have been aligned to a
reference genome as they are typically generated in next generation
sequencing experiments.
In the most common case AlignmentsTrack objects will be created
directly from BAM files, and we strongly recommend to do
this. A BAM file contains all the information that is needed to
properly display the aligned reads, but more importantly, it allows to
dynamically stream the data for the desired plotting range off the
disk rather than having to load potentially gigantic amounts of data
into memory upon object instantiation. That being said, there are
other starting points to build AlignmentsTracks.
range
An optional meta argument to handle the different input types. If
the range argument is missing, all the relevant information
to create the object has to be provided as individual function
arguments (see below).
The different input options for range are:
A character string: the path to a BAM file
containing the read alignments. To be precise, this will result
in the instantiation of a ReferenceAlignmentsTrack
object, but for the user this implementation detail should be of
no concern.
A GRanges object: the genomic ranges of the
individual reads as well as the optional additional
metadata columns id, cigar,
mapq, flag, isize, groupid,
status, md and seqs (see description of the
individual function parameters below for details). Calling the
constructor on a GRanges object without further
arguments, e.g. AlignmentsTrack(range=obj) is equivalent
to calling the coerce method as(obj, "AlignmentsTrack").
An IRanges object: almost identical
to the GRanges case, except that the chromosome and
strand information as well as all additional metadata has to be
provided in the separate chromosome, strand,
feature, group or id arguments, because it
can not be directly encoded in an IRanges object. Note
that none of those inputs are mandatory, and if not provided
explicitely the more or less reasonable default values
chromosome=NA and strand="*" are used.
A data.frame object: the data.frame needs to
contain at least the two mandatory columns start and
end with the range coordinates. It may also contain a
chromosome and a strand column with the chromosome
and strand information for each range. If missing it will be
drawn from the separate chromosome or strand
arguments. In addition, the id, cigar,
mapq, flag, isize, groupid,
status, md and seqs data can be provided as
additional columns. The above comments about potential default
values also apply here.
start, end, width
Integer vectors, giving the start and the
end coordinates for the individual track items, or their
width. Two of the three need to be specified, and have to be of
equal length or of length one, in which case this single value
will be recycled. Otherwise, the usual R recycling rules for
vectors do not apply here.
id
Character vector of read identifiers. Those identifiers have
to be unique, i.e., each range representing a read needs to have a
unique id.
cigar
A character vector of valid CIGAR strings describing
details of the alignment. Typically those include alignemnts gaps or
insertions and deletions, but also hard and soft clipped read
regions. If missing, a fully mapped read without gaps or indels is
assumed. Needs to be of equal length as the provided genomic
coordinates, or of length 1.
mapq
A numeric vector of read mapping qualities. Needs to be of
equal length as the provided genomic coordinates, or of length 1.
flag
A numeric vector of flag values. Needs to be of equal
length as the provided genomic coordinates, or of length
1. Currently not used.
isize
A numeric vector of empirical insert sizes. This only
applies if the reads are paired. Needs to be of equal length as the
provided genomic coordinates, or of length 1. Currently not used.
groupid
A factor (or vector than can be coerced into one)
defining the read pairs. Reads with the same groupid are
considered to be mates. Please note that each read group may only
have one or two members. Needs to be of equal length as the provided
genomic coordinates, or of length 1.
status
A factor describing the mapping status of a read. Has to
be one in mated, unmated or ambiguous. Needs to
be of equal length as the provided genomic coordinates, or of length
1.
md
A character vector describing the mapping details. This is
effectively and alternative to the CIGAR encoding and it removes the
dependency on a reference sequence to figure out read
mismatches. Needs to be of equal length as the provided genomic
coordinates, or of length 1. Currently not used.
seqs
DNAStringSet of read sequences.
strand
Character vector, the strand information for the
reads. It may be provided in the form + for the Watson
strand, - for the Crick strand or * for either one of
the two. Needs to be of equal length as the provided genomic
coordinates, or of length 1. Please note that paired reads need to
be on opposite strands, and erroneous entries will result in casting
of an error.
chromosome
The chromosome on which the track's genomic ranges
are defined. A valid UCSC chromosome identifier if
options(ucscChromosomeNames=TRUE). Please note that in this
case only syntactic checking takes place, i.e., the argument value
needs to be an integer, numeric character or a character of the form
chrx, where x may be any possible string. The user has
to make sure that the respective chromosome is indeed defined for
the the track's genome. If not provided here, the constructor will
try to construct the chromosome information based on the available
inputs, and as a last resort will fall back to the value
chrNA. Please note that by definition all objects in the
Gviz package can only have a single active chromosome at a
time (although internally the information for more than one
chromosome may be present), and the user has to call the
chromosome<- replacement method in order to change to a
different active chromosome.
genome
The genome on which the track's ranges are
defined. Usually this is a valid UCSC genome identifier, however
this is not being formally checked at this point. If not provided
here the constructor will try to extract this information from the
provided input, and eventually will fall back to the default value
of NA.
stacking
The stacking type for overlapping items of the
track. One in c(hide, dense, squish, pack, full). Currently,
only squish (make best use of the available space), dense (no
stacking, collapse overlapping ranges), and hide (do not show any
track items at all) are implemented.
name
Character scalar of the track's name used in the title
panel when plotting.
isPaired
A logical scalar to determine whether the reads are
paired or not. While this may be used to render paired-end data as
single-end, the oppsite will typically not have any effect because
the appropriate groupid settings will not be present. Thus
setting isPaired to TRUE can usually be used to
autodetect the pairing state of the input data.
importFunction
A user-defined function to be used to import the
data from a file. This only applies when the range argument
is a character string with the path to the input data file. The
function needs to accept an argument x containing the file
path and a second argument selection with the desired
plotting ranges. It has to return a proper GRanges object
with all the necessary metadata columns set. A single
default import function is already implemented in the package for
BAM files.
referenceSequence
An optional
SequenceTrack object containing the reference
sequence against which the reads have been aligned. This is only
needed when mismatch information has to be added to the plot (i.e.,
the showMismatchs display parameter is TRUE) because
this is normally not encoded in the BAM file. If not provided
through this argument, the plotTracks function is
smart enough to detect the presence of a
SequenceTrack object in the track list and will
use that as a reference sequence.
...
Additional items which will all be interpreted as further
display parameters. See settings and the "Display
Parameters" section below for details.
Value
The return value of the constructor function is a new object of class
AlignmentsTrack or ReferenceAlignmentsTrack.
Objects from the Class
Objects can be created using the constructor function AlignmentsTrack.
details
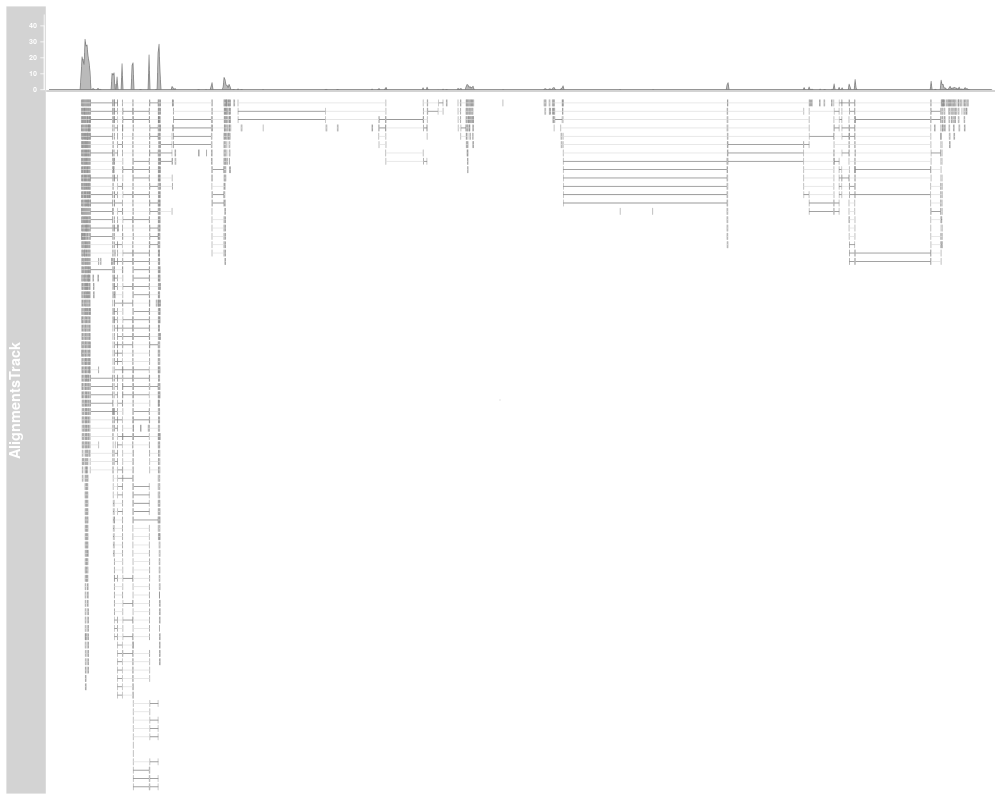
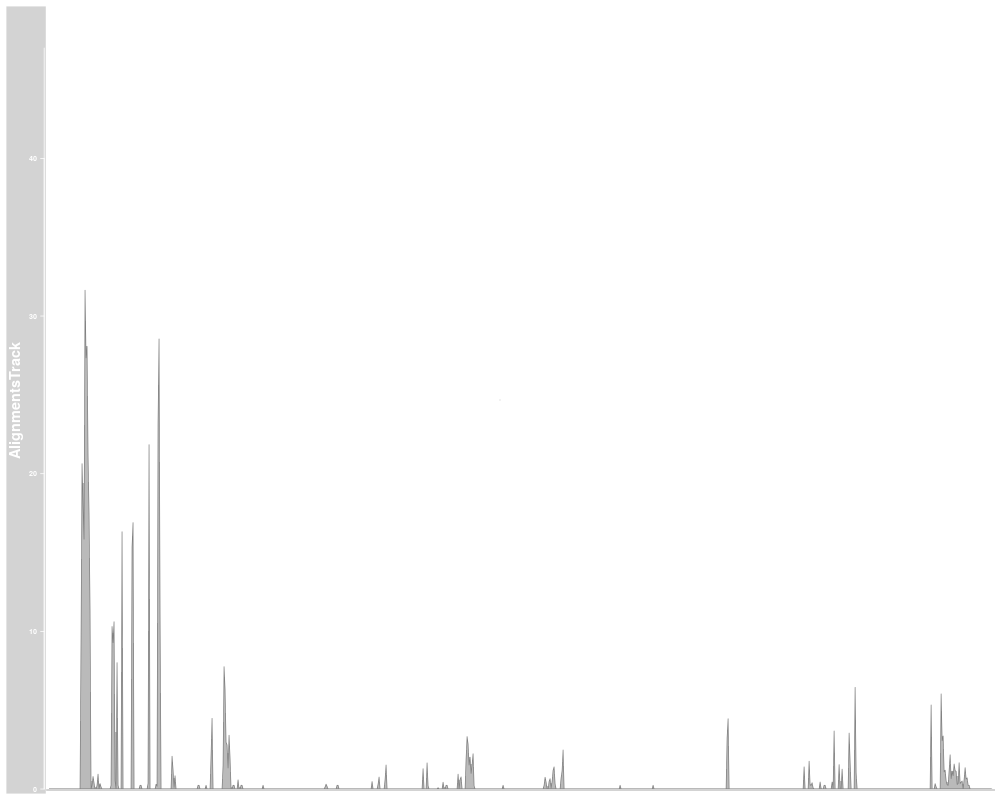
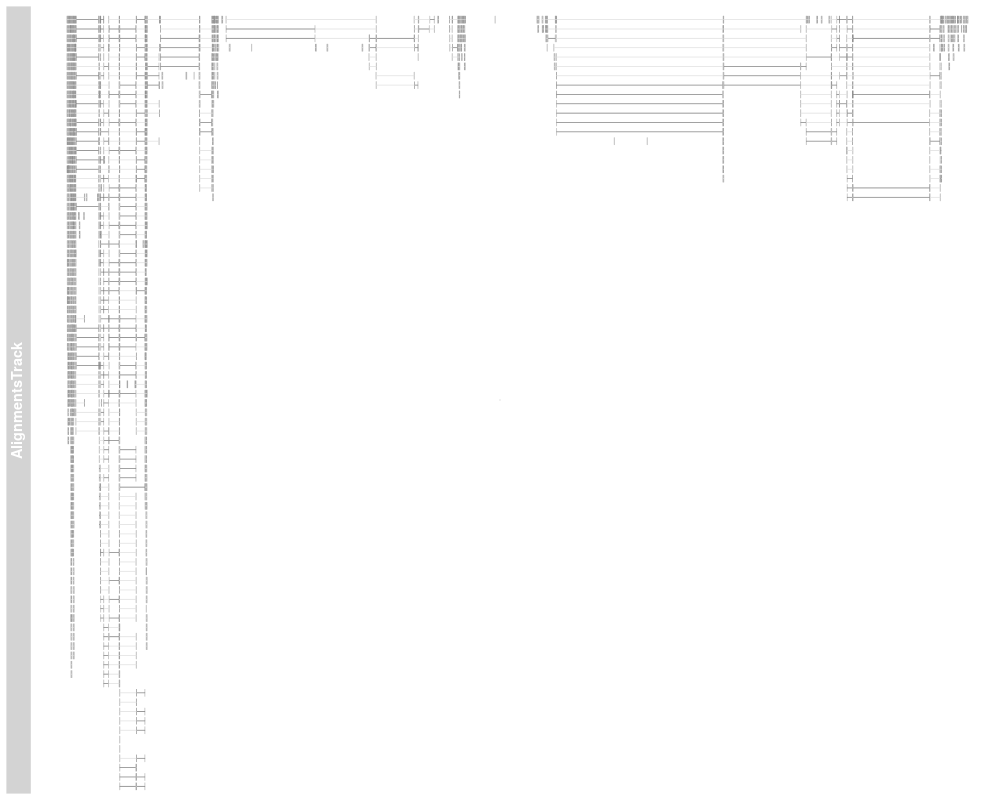
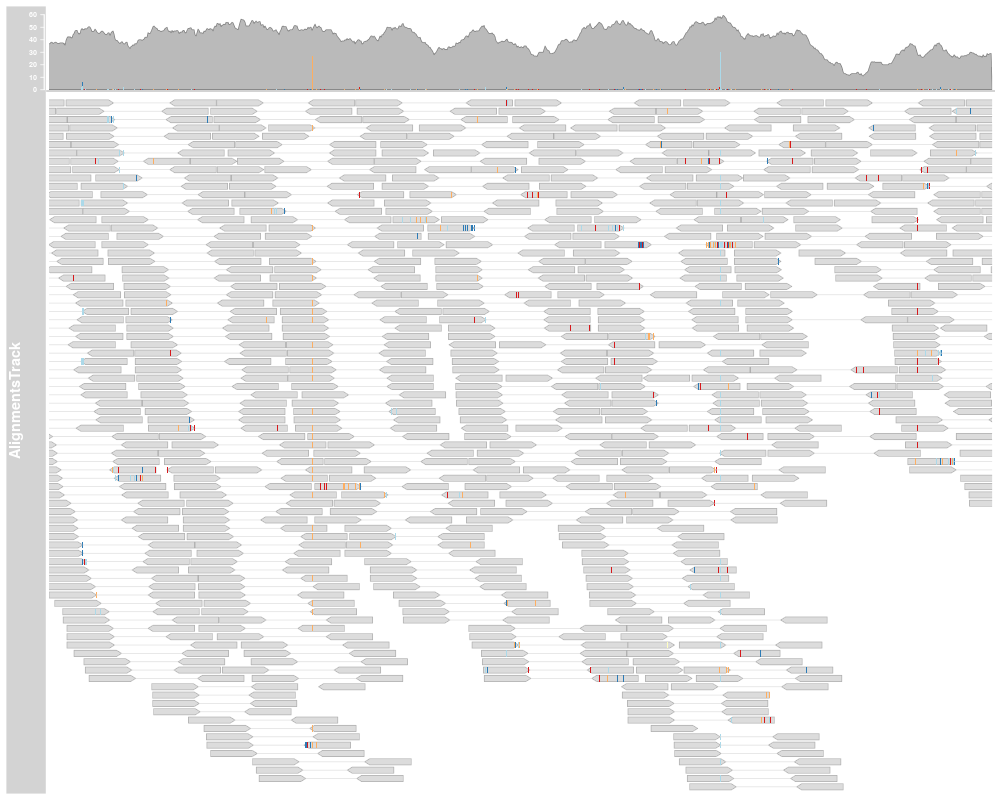
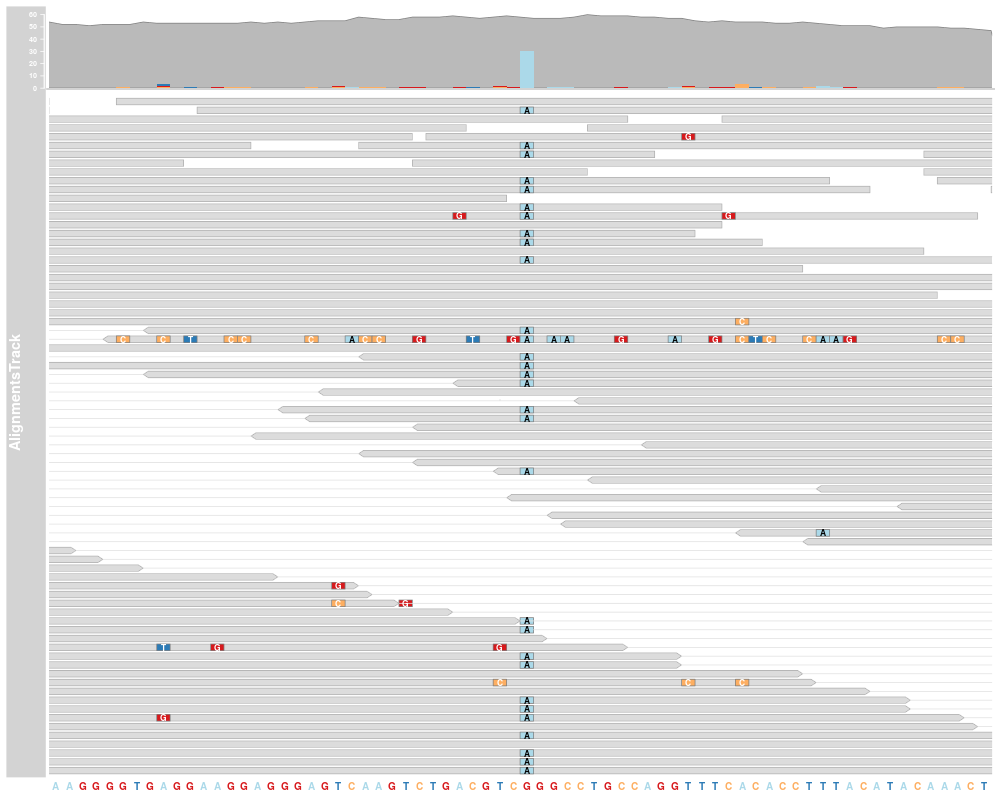
AlignmentTracks usually have two section: the coverage section
on top showing a histogram of the read coverage, and the pile-up
section below with the individual reads. Both can be toggled on or off
using the type display parameter. If reference sequence has
been provided either during object instantiation or with the track
list to the call to plotTracks, sequence mismatch information
will be shown in both sections: as a stacked histogram in the coverage
plot and as colored boxes or characters (depending on available space)
in for the pile-ups.
Slots
stackRanges:
Object of class "GRanges", the
ranges of the precomputed mate or gaps stacks that should remain
conmnected.
sequences:
Object of class "DNAStringSet", the
processed read sequences.
referenceSequence:
Object of class "SequenceTrack", the
reference sequence to which the reads have been aligned to.
stacking:
Object of class "character",
inherited from class StackedTrack
stacks:
Object of class "environment",
inherited from class StackedTrack
range:
Object of class GRanges,
inherited from class RangeTrack
chromosome:
Object of class "character",
inherited from class RangeTrack
genome:
Object of class "character", inherited
from class RangeTrack
dp:
Object of class
DisplayPars, inherited from class
GdObject
name:
Object of class "character", inherited
from class GdObject
imageMap:
Object of class
ImageMap, inherited from class
GdObject
Extends
Class "StackedTrack", directly.
Class "RangeTrack", by class "StackedTrack",
distance2.
Class "GdObject", by class "StackedTrack",
distance3.
Methods
In the following code chunks, obj is considered to be an object
of class AlignmentsTrack.
Exported in the name space:
[
signature(x="AlignmentsTrack"): subset the items in
the AlignmentsTrack. This is essentially similar to
subsetting of the GRanges object in the
range slot. For most applications, the subset method
may be more appropriate.
Additional Arguments:
i: subsetting indices
Examples:
obj[1:5]
subset
signature(x="AlignmentsTrack"): subset a
AlignmentsTrack by coordinates and sort if necessary.
Usage:
subset(x, from, to, sort=FALSE, stacks=FALSE)
Additional Arguments:
from, to: the coordinates range to subset
to.
sort: sort the object after subsetting. Usually
not necessary.
stacks: recompute the stacking after subsetting
which can be expensive and is not always necessary.
signature(x="AlignmentsTrack"): split an
AlignmentsTrack object by an appropriate factor vector (or
another vector that can be coerced into one). The output of this
operation is a list of AlignmentsTrack objects.
Additional Arguments:
f: the splitting factor.
...: all further arguments are ignored.
Usage:
split(x, f, ...)
Examples:
split(obj, c("a", "a", "b", "c", "a"))
Internal methods:
drawAxis
signature(GdObject="AlignmentsTrack"): add a y-axis
to the title panel of a track.
Usage:
drawAxis(GdObject, from, to, subset=FALSE, ...)
Additional Arguments:
from, to: compute axis range from the data
within a certain coordinates range only.
subset: subset the object prior to calculating
the axis ranges. Can be expensive and is not always needed.
...: all further arguments are ignored.
Examples:
Gviz:::drawAxis(obj)
drawGD
signature(gdObject="AlignmentsTrack"): plot the
object to a graphics device. The return value of this method is
the input object, potentially updated during the plotting
operation. Internally, there are two modes in which the method can
be called. Either in 'prepare' mode, in which case no plotting is
done but the object is preprocessed based on the
available space, or in 'plotting' mode, in which case the actual
graphical output is created. Since subsetting of the object can be
potentially costly, this can be switched off in case subsetting
has already been performed before or is not necessary.
prepare: run method in preparation or in
production mode.
subset: subset the object to the visible region
or skip the potentially expensive subsetting operation.
...: all further arguments are ignored.
Examples:
Gviz:::drawGD(obj)
Gviz:::drawGD(obj, minBase=1, maxBase=100)
Gviz:::drawGD(obj, prepare=TRUE,
	    subset=FALSE)
initialize
signature(.Object="AligendReadTrack"):
initialize the object.
show
signature(object="AlignmentsTrack"): show a
human-readable summary of the object.
Inherited methods:
stacking
signature(GdObject="AlignmentsTrack"): return
the current stacking type.
Usage:
stacking(GdObject)
Examples:
stacking(obj)
stacking<-
signature(GdObject="AlignmentsTrack",
      value="character")
: set the object's stacking type to one in
c(hide, dense, squish, pack,full).
Usage:
stacking<-(GdObject, value)
Additional Arguments:
value: replacement value.
Examples:
stacking(obj) <- "squish"
setStacks
signature(GdObject="AlignmentsTrack"):
recompute the stacks based on the available space and on the
object's track items and stacking settings.
Usage:
setStacks(GdObject, from, to)
Additional Arguments:
from, to: compute stacking within a
certain coordinates range. This needs to be supplied for the
plotting function to know the current genomic coordinates.
Examples:
Gviz:::setStacks(obj)
stacks
signature(GdObject="AlignmentsTrack"): return
the stack indices for each track item.
Usage:
stacks(GdObject)
Examples:
Gviz:::stacks(obj)
chromosome
signature(GdObject="AlignmentsTrack"):
return the chromosome for which the track is defined.
Usage:
chromosome(GdObject)
Examples:
chromosome(obj)
chromosome<-
signature(GdObject="AlignmentsTrack"):
replace the value of the track's chromosome. This has to be a
valid UCSC chromosome identifier or an integer or character
scalar that can be reasonably coerced into one.
Usage:
chromosome<-(GdObject, value)
Additional Arguments:
value: replacement value.
Examples:
chromosome(obj) <- "chr12"
start, end, width
signature(x="AlignmentsTrack"): the
start or end coordinates of the track items, or their width in
genomic coordinates.
Usage:
start(x)
end(x)
width(x)
Examples:
start(obj)
end(obj)
width(obj)
start<-, end<-, width<-
signature(x="AlignmentsTrack"):
replace the start or end coordinates of the track items, or their
width.
Usage:
start<-(x, value)
end<-(x, value)
width<-(x, value)
Additional Arguments:
value: replacement value.
Examples:
start(obj) <- 1:10
end(obj) <- 20:30
width(obj) <- 1
position
signature(GdObject="AlignmentsTrack"): the
arithmetic mean of the track item's coordionates, i.e.,
(end(obj)-start(obj))/2.
Usage:
position(GdObject)
Examples:
position(obj)
feature
signature(GdObject="AlignmentsTrack"): return the
grouping information for track items. For certain sub-classes,
groups may be indicated by different color schemes when
plotting. See grouping or
AnnotationTrack and
GeneRegionTrack for details.
Usage:
feature(GdObject)
Examples:
feature(obj)
feature<-
signature(gdObject="AlignmentsTrack",
      value="character")
: set the grouping information for track
items. This has to be a factor vector (or another type of vector
that can be coerced into one) of the same length as the number of
items in the AlignmentsTrack. See grouping or
AnnotationTrack and
GeneRegionTrack for details.
Usage:
feature<-(GdObject, value)
Additional Arguments:
value: replacement value.
Examples:
feature(obj) <- c("a", "a", "b", "c", "a")
genome
signature(x="AlignmentsTrack"): return the track's genome.
Usage:
genome(x)
Examples:
genome(obj)
genome<-
signature(x="AlignmentsTrack"): set the track's
genome. Usually this has to be a valid UCSC identifier, however
this is not formally enforced here.
Usage:
genome<-(x, value)
Additional Arguments:
value: replacement value.
Examples:
genome(obj) <- "mm9"
length
signature(x="AlignmentsTrack"): return the number
of items in the track.
Usage:
length(x)
Examples:
length(obj)
range
signature(x="AlignmentsTrack"): return the genomic
coordinates for the track as an object of class
IRanges.
Usage:
range(x)
Examples:
range(obj)
ranges
signature(x="AlignmentsTrack"): return the genomic
coordinates for the track along with all additional annotation
information as an object of class GRanges.
Usage:
ranges(x)
Examples:
ranges(obj)
strand
signature(x="AlignmentsTrack"): return a vector of
strand specifiers for all track items, in the form '+' for the
Watson strand, '-' for the Crick strand or '*' for either of the
two.
Usage:
strand(x)
Examples:
strand(obj)
strand<-
signature(x="AlignmentsTrack"): replace the
strand information for the track items. The replacement value
needs to be an appropriate scalar or vector of strand values.
Usage:
strand<-(x, value)
Additional Arguments:
value: replacement value.
Examples:
strand(obj) <- "+"
values
signature(x="AlignmentsTrack"): return all
additional annotation information except for the genomic coordinates
for the track items as a data.frame.
Usage:
values(x)
Examples:
values(obj)
coerce
signature(from="AlignmentsTrack",
	to="data.frame")
: coerce the GRanges
object in the range slot into a regular data.frame.
Examples:
as(obj, "data.frame")
displayPars
signature(x="AlignmentsTrack",
      name="character")
: list the value of the display parameter
name. See settings for details on display
parameters and customization.
Usage:
displayPars(x, name)
Examples:
displayPars(obj, "col")
displayPars
signature(x="AlignmentsTrack",
      name="missing")
: list the value of all available display
parameters. See settings for details on display
parameters and customization.
Examples:
displayPars(obj)
getPar
signature(x="AlignmentsTrack", name="character"):
alias for the displayPars method. See
settings for details on display parameters and
customization.
Usage:
getPar(x, name)
Examples:
getPar(obj, "col")
getPar
signature(x="AlignmentsTrack", name="missing"):
alias for the displayPars method. See
settings for details on display parameters and
customization.
Examples:
getPar(obj)
displayPars<-
signature(x="AlignmentsTrack",
      value="list")
: set display parameters using the values of the
named list in value. See settings for details
on display parameters and customization.
Usage:
displayPars<-(x, value)
Examples:
displayPars(obj) <- list(col="red", lwd=2)
setPar
signature(x="AlignmentsTrack", value="character"):
set the single display parameter name to value. Note
that display parameters in the AlignmentsTrack class are
pass-by-reference, so no re-assignmnet to the symbol obj is
necessary. See settings for details on display
parameters and customization.
Usage:
setPar(x, name, value)
Additional Arguments:
name: the name of the display parameter to set.
Examples:
setPar(obj, "col", "red")
setPar
signature(x="AlignmentsTrack", value="list"): set
display parameters by the values of the named list in
value. Note that display parameters in the
AlignmentsTrack class are pass-by-reference, so no
re-assignmnet to the symbol obj is necessary. See
settings for details on display parameters and
customization.
Examples:
setPar(obj, list(col="red", lwd=2))
group
signature(GdObject="AlignmentsTrack"): return
grouping information for the individual items in the track. Unless
overwritten in one of the sub-classes, this usualy returns
NULL.
Usage:
group(GdObject)
Examples:
group(obj)
names
signature(x="AlignmentsTrack"): return the value of
the name slot.
Usage:
names(x)
Examples:
names(obj)
names<-
signature(x="AlignmentsTrack", value="character"):
set the value of the name slot.
Usage:
names<-(x, value)
Examples:
names(obj) <- "foo"
coords
signature(ImageMap="AlignmentsTrack"): return the
coordinates from the internal image map.
Usage:
coords(ImageMap)
Examples:
coords(obj)
tags
signature(x="AlignmentsTrack"): return the tags from the
internal image map.
Usage:
tags(x)
Examples:
tags(obj)
Display Parameters
The following display parameters are set for objects of class
AlignmentsTrack upon instantiation, unless one or more of
them have already been set by one of the optional sub-class initializers,
which always get precedence over these global defaults. See
settings for details on setting graphical parameters
for tracks.
alpha.mismatch=NULL: Numeric scalar between 0 and 1. The
transparency of the mismatch base information.
alpha.reads=0.5: Numeric scalar between 0 and 1. The
transparency of the individual read icons. Can be used to indicate
overlapping regions in read pairs. Only on supported devices.
cex.mismatch=0.7: Numeric Scalar. The character
expansion factor for the mismatch base letters.
col.coverage=NULL: Integer or character
scalar. The line color for the coverage profile.
col.gap=.DEFAULT_SHADED_COL: Integer or character
scalar. The color of the line that is bridging the gap regions in
gapped alignments.
col.mates=.DEFAULT_BRIGHT_SHADED_COL: Integer or
character scalar. The color of the line that is connecting two
paired reads.
col.mismatch=.DEFAULT_SHADED_COL: Integer or
character scalar. The box color around mismatch bases.
col.reads=NULL: Integer or
character scalar. The box color around reads.
col=.DEFAULT_SHADED_COL: Integer or character
scalar. The default color of all line elements.
collapse=FALSE: Logical scalar. Do not perform any
collapsing of overlapping elements. Currently not supported.
coverageHeight=0.1: Numeric scalar. The height of the
coverage region of the track. Can either be a value between 0 and
1 in which case it is taken as a relative height, or a positive
value greater 1 in which case it is interpreted as pixels.
fill.coverage=NULL: Integer or character
scalar. The fill color for the coverage profile.
fill.reads=NULL: Integer or character
scalar. The fill color for the read icons.
fill="#BABABA": Integer or character
scalar. The default fill color of all plot elements.
fontface.mismatch=2: Integer scalar. The font face
for mismatch bases.
lty.coverage=NULL: Integer or character scalar. The line
type of the coverage profile.
lty.gap=NULL: Integer or character scalar. The type
of the line that is bridging the gap regions in gapped
alignments.
lty.mates=NULL: Integer or character scalar. The
type of the line that is connecting two paired reads.
lty.mismatch=NULL: Integer or character scalar. The box
line type around mismatch bases.
lty.reads=NULL: Integer or character scalar. The box
line type around reads.
lty=1: Integer or character scalar. The default type
of all line elements.
lwd.coverage=NULL: Integer or character scalar. The line
width of the coverage profile.
lwd.gap=NULL: Integer scalar. The width of the line
that is bridging the gap regions in gapped alignments.
lwd.mates=NULL: Integer scalar. The width of the
line that is connecting two paired reads.
lwd.mismatch=NULL: Integer scalar.The box
line width around mismatch bases.
lwd.reads=NULL: Integer scalar.The box
line width around reads.
lwd=1: Integer scalar. The default width of all line
elements.
noLetters=FALSE: Logical scalar. Always plot colored
boxes for mismatch bases regardles of the available space.
max.height=10: Integer scalar. The maximum height
of an individual read in pixels. Can be used in combination with
min.height to control the read and stacking appearance.
min.height=5: Integer scalar. The minimum height of
an individual read in pixels. Can be used in combination with
max.height to control the read and stacking appearance.
minCoverageHeight=50: Integer scalar. The minimum
height of the coverage section. Uselful in combination with a
relative setting of coverageHeight.
showMismatches=TRUE: Logical scalar. Add mismatch
information, either as individual base letters or using color
coded bars. This implies that the reference sequence has been
provided, either to the class constructor or as part of the
track list.
size=NULL: Numeric scalar. The size of the
track. Defaults to automatic sizing.
type=c("coverage", "pileup"): Character vactor. The
type of information to plot. For coverage a coverage plot,
potentially augmented by base mismatch information, and for
"pileup" the pileups of the individual reads. The two can
be combined.
Additional display parameters are being inherited from the respective
parent classes. Note that not all of them may have an effect on the
plotting of AlignmentsTrack objects.
StackedTrack:
reverseStacking=FALSE: Logical flag. Reverse the
y-ordering of stacked items. I.e., features that are plotted on
the bottom-most stacks will be moved to the top-most stack and
vice versa.
stackHeight=0.75: Numeric between 0 and 1. Controls
the vertical size and spacing between stacked elements. The number
defines the proportion of the total available space for the stack
that is used to draw the glyphs. E.g., a value of 0.5 means that
half of the available vertical drawing space (for each stacking
line) is used for the glyphs, and thus one quarter of the available
space each is used for spacing above and below the glyph. Defaults
to 0.75.
GdObject:
alpha=1: Numeric scalar. The transparency for
all track items.
background.panel="transparent": Integer or
character scalar. The background color of the content panel.
background.title="lightgray": Integer or character
scalar. The background color for the title panels.
col.border.title="transparent": Integer or character
scalar. The border color for the title panels.
lwd.border.title=1: Integer scalar. The border
width for the title panels.
cex=1: Numeric scalar. The overall font expansion
factor for all text.
cex.axis=NULL: Numeric scalar. The expansion
factor for the axis annotation. Defaults to NULL, in
which case it is computed based on the available space.
cex.title=NULL: Numeric scalar. The expansion
factor for the title panel. This effects the fontsize of both
the title and the axis, if any. Defaults to NULL,
which means that the text size is automatically adjusted to
the available space.
col="#0080FF": Integer or character scalar.
Default line color setting for all plotting elements, unless
there is a more specific control defined elsewhere.
col.axis="white": Integer or character scalar.
The font and line color for the y axis, if any.
col.frame="lightgray": Integer or character
scalar. The line color used for the panel frame, if
frame==TRUE
col.grid="#808080": Integer or character scalar.
Default line color for grid lines, both when type=="g"
in DataTracks and when display parameter
grid==TRUE.
col.line=NULL: Integer or character scalar.
Default colors for plot lines. Usually the same as the global
col parameter.
col.symbol=NULL: Integer or character scalar.
Default colors for plot symbols. Usually the same as the
global col parameter.
col.title="white": Integer or character scalar.
The font color for the title panels.
fontcolor="black": Integer or character scalar.
The font color for all text.
fontface=1: Integer or character scalar. The
font face for all text.
fontface.title=2: Integer or character scalar.
The font face for the title panels.
fontfamily="sans": Integer or character scalar.
The font family for all text.
fontfamily.title="sans": Integer or character
scalar. The font family for the title panels.
fontsize=12: Numeric scalar. The font size for
all text.
frame=FALSE: Boolean. Draw a frame around the
track when plotting.
grid=FALSE: Boolean, switching on/off the plotting
of a grid.
h=-1: Integer scalar. Parameter controlling the
number of horizontal grid lines, see panel.grid
for details.
lineheight=1: Numeric scalar. The font line
height for all text.
lty="solid": Numeric scalar. Default line type
setting for all plotting elements, unless there is a more
specific control defined elsewhere.
lty.grid="solid": Integer or character scalar.
Default line type for grid lines, both when type=="g"
in DataTracks and when display parameter
grid==TRUE.
lwd=1: Numeric scalar. Default line width setting
for all plotting elements, unless there is a more specific
control defined elsewhere.
lwd.grid=1: Numeric scalar. Default line width
for grid lines, both when type=="g" in DataTracks
and when display parameter grid==TRUE.
min.distance=1: Numeric scalar. The minimum
pixel distance before collapsing range items, only if
collapse==TRUE. See collapsing for details.
min.height=3: Numeric scalar. The minimum range
height in pixels to display. All ranges are expanded to this
size in order to avoid rendering issues. See collapsing
for details.
min.width=1: Numeric scalar. The minimum range
width in pixels to display. All ranges are expanded to this
size in order to avoid rendering issues. See collapsing
for details.
showAxis=TRUE: Boolean controlling whether to
plot a y axis (only applies to track types where axes are
implemented).
showTitle=TRUE: Boolean controlling whether to
plot a title panel. Although this can be set individually
for each track, in multi-track plots as created by
plotTracks there will still be an empty
placeholder in case any of the other tracks include a title.
The same holds true for axes. Note that the the title panel
background color could be set to transparent in order to
completely hide it.
v=-1: Integer scalar. Parameter controlling the
number of vertical grid lines, see panel.grid
for details.
Author(s)
Florian Hahne
See Also
AnnotationTrack
DataTrack
DisplayPars
GdObject
GeneRegionTrack
GRanges
ImageMap
IRanges
RangeTrack
StackedTrack
collapsing
grouping
panel.grid
plotTracks
settings
Examples
## Creating objects
afrom <- 2960000
ato <- 3160000
alTrack <- AlignmentsTrack(system.file(package="Gviz", "extdata",
"gapped.bam"), isPaired=TRUE)
plotTracks(alTrack, from=afrom, to=ato, chromosome="chr12")

## Omit the coverage or the pile-ups part
plotTracks(alTrack, from=afrom, to=ato, chromosome="chr12",
type="coverage")
plotTracks(alTrack, from=afrom, to=ato, chromosome="chr12",
type="pileup")

## Including sequence information with the constructor
if(require(BSgenome.Hsapiens.UCSC.hg19)){
strack <- SequenceTrack(Hsapiens, chromosome="chr21")
afrom <- 44945200
ato <- 44947200
alTrack <- AlignmentsTrack(system.file(package="Gviz", "extdata",
"snps.bam"), isPaired=TRUE, referenceSequence=strack)
plotTracks(alTrack, chromosome="chr21", from=afrom, to=ato)

## Including sequence information in the track list
alTrack <- AlignmentsTrack(system.file(package="Gviz", "extdata",
"snps.bam"), isPaired=TRUE)
plotTracks(c(alTrack, strack), chromosome="chr21", from=44946590,
to=44946660)
}
Results
R version 3.3.1 (2016-06-21) -- "Bug in Your Hair"
Copyright (C) 2016 The R Foundation for Statistical Computing
Platform: x86_64-pc-linux-gnu (64-bit)

R is free software and comes with ABSOLUTELY NO WARRANTY.
You are welcome to redistribute it under certain conditions.
Type 'license()' or 'licence()' for distribution details.

R is a collaborative project with many contributors.
Type 'contributors()' for more information and
'citation()' on how to cite R or R packages in publications.

Type 'demo()' for some demos, 'help()' for on-line help, or
'help.start()' for an HTML browser interface to help.
Type 'q()' to quit R.

> library(Gviz)
Loading required package: S4Vectors
Loading required package: stats4
Loading required package: BiocGenerics
Loading required package: parallel

Attaching package: 'BiocGenerics'

The following objects are masked from 'package:parallel':

    clusterApply, clusterApplyLB, clusterCall, clusterEvalQ,
    clusterExport, clusterMap, parApply, parCapply, parLapply,
    parLapplyLB, parRapply, parSapply, parSapplyLB

The following objects are masked from 'package:stats':

    IQR, mad, xtabs

The following objects are masked from 'package:base':

    Filter, Find, Map, Position, Reduce, anyDuplicated, append,
    as.data.frame, cbind, colnames, do.call, duplicated, eval, evalq,
    get, grep, grepl, intersect, is.unsorted, lapply, lengths, mapply,
    match, mget, order, paste, pmax, pmax.int, pmin, pmin.int, rank,
    rbind, rownames, sapply, setdiff, sort, table, tapply, union,
    unique, unsplit


Attaching package: 'S4Vectors'

The following objects are masked from 'package:base':

    colMeans, colSums, expand.grid, rowMeans, rowSums

Loading required package: IRanges
Loading required package: GenomicRanges
Loading required package: GenomeInfoDb
Loading required package: grid
> png(filename="/home/ddbj/snapshot/RGM3/R_BC/result/Gviz/AlignmentsTrack.Rd_%03d_medium.png", width=480, height=480)
> ### Name: AlignmentsTrack-class
> ### Title: AlignmentsTrack class and methods
> ### Aliases: AlignmentsTrack-class AlignmentsTrack
> ###   chromosome<-,AlignmentsTrack-method drawAxis,AlignmentsTrack-method
> ###   drawGD,AlignmentsTrack-method [,AlignmentsTrack,ANY,ANY-method
> ###   coverage,AlignmentsTrack-method initialize,AlignmentsTrack-method
> ###   initialize,ReferenceAlignmentsTrack-method
> ###   subset,AlignmentsTrack-method subset,ReferenceAlignmentsTrack-method
> ###   stacks,AlignmentsTrack-method values,AlignmentsTrack-method
> ###   show,AlignmentsTrack-method
> ### Keywords: classes
>
> ### ** Examples
>
> ## Creating objects
> afrom <- 2960000
> ato <- 3160000
> alTrack <- AlignmentsTrack(system.file(package="Gviz", "extdata",
+ "gapped.bam"), isPaired=TRUE)
> plotTracks(alTrack, from=afrom, to=ato, chromosome="chr12")
>
> ## Omit the coverage or the pile-ups part
> plotTracks(alTrack, from=afrom, to=ato, chromosome="chr12",
+ type="coverage")
> plotTracks(alTrack, from=afrom, to=ato, chromosome="chr12",
+ type="pileup")
>
> ## Including sequence information with the constructor
> if(require(BSgenome.Hsapiens.UCSC.hg19)){
+ strack <- SequenceTrack(Hsapiens, chromosome="chr21")
+ afrom <- 44945200
+ ato <- 44947200
+ alTrack <- AlignmentsTrack(system.file(package="Gviz", "extdata",
+ "snps.bam"), isPaired=TRUE, referenceSequence=strack)
+ plotTracks(alTrack, chromosome="chr21", from=afrom, to=ato)
+
+ ## Including sequence information in the track list
+ alTrack <- AlignmentsTrack(system.file(package="Gviz", "extdata",
+ "snps.bam"), isPaired=TRUE)
+ plotTracks(c(alTrack, strack), chromosome="chr21", from=44946590,
+ to=44946660)
+ }
Loading required package: BSgenome.Hsapiens.UCSC.hg19
Loading required package: BSgenome
Loading required package: Biostrings
Loading required package: XVector
Loading required package: rtracklayer
>
>
>
>
>
>
> dev.off()
null device
          1
>
 .
.