A fairly generic track object for arbitrary genomic range annotations,
with the option of grouped track items. The extended
DetailsAnnotationTrack provides a more flexible interface to
add user-defined custom information for each range.
AnnotationTrack object can be created from a variety of
different inputs in order to nicely embed the package into the
existing Bioconductor landscape. Since the main components of this
class are essentially genomic ranges, the obvious Bioconductor
representation is most likely a GRanges object,
or, for grouped elements, a GRangesList. However,
in certain cases it may be desirable to build the object from
individual function arguments.
range
An optional meta argument to handle the different input types. If
the range argument is missing, all the relevant information
to create the object has to be provided as individual function
arguments (see below).
The different input options for range are:
A GRanges object: the genomic ranges for the
Annotation track as well as the optional additional
metadata columns feature, group and
id (see description of the individual function parameters
below for details). Calling the constructor on a GRanges
object without further arguments, e.g.
AnnotationTrack(range=obj) is equivalent to calling the coerce
method as(obj, "AnnotationTrack").
A GRangesList object: this is very similar to the
previous case, except that the grouping information that is part
of the list structure is preserved in the
AnnotationTrack. I.e., all the elements within one list
item receive the same group id. For consistancy, there is also a
coercion method from GRangesListsas(obj,
"AnnotationTrack").
An IRanges object: almost identical
to the GRanges case, except that the chromosome and
strand information as well as all additional metadata has to be
provided in the separate chromosome, strand,
feature, group or id arguments, because it
can not be directly encoded in an IRange object. Note
that none of those inputs are mandatory, and if not provided
explicitely the more or less reasonable default values
chromosome=NA and strand="*" are used.
A data.frame object: the data.frame needs to
contain at least the two mandatory columns start and
end with the range coordinates. It may also contain a
chromosome and a strand column with the chromosome
and strand information for each range. If missing it will be
drawn from the separate chromosome or strand
arguments. In addition, the feature, group and
id data can be provided as additional columns. The above
comments about potential default values also apply here.
A character scalar: in this case the value of the
range argument is considered to be a file path to an
annotation file on disk. A range of file types are supported by
the Gviz package as identified by the file extension. See
the importFunction documentation below for further
details.
start, end, width
Integer vectors, giving the start and the end
end coordinates for the individual track items, or their width. Two
of the three need to be specified, and have to be of equal length or
of length one, in which case this single value will be
recycled. Otherwise, the usual R recycling rules for vectors do not
apply here.
feature
Factor (or other vector that can be coerced into one),
giving the feature types for the individual track items. When
plotting the track to the device, if a display parameter with the
same name as the value of feature is set, this will be used
as the track item's fill color. See grouping for
details. Needs to be of equal length as the provided genomic
coordinates, or of length 1.
group
Factor (or other vector that can be coerced into one),
giving the group memberships for the individual track items. When
plotting to the device, all items in the same group will be
connected. See grouping for details. Needs to be of
equal length as the provided genomic coordinates, or of length 1.
id
Character vector of track item identifiers. When plotting to
the device, it's value will be used as the identifier tag if the
display parameter showFeatureId=TRUE. Needs to be of equal
length as the provided genomic ranges, or of length 1.
strand
Character vector, the strand information for the
individual track items. It may be provided in the form + for
the Watson strand, - for the Crick strand or * for
either one of the two. Needs to be of equal length as the provided
genomic coordinates, or of length 1. Please note that grouped items
need to be on the same strand, and erroneous entries will result in
casting of an error.
chromosome
The chromosome on which the track's genomic ranges
are defined. A valid UCSC chromosome identifier if
options(ucscChromosomeNames=TRUE). Please note that in this
case only syntactic checking takes place, i.e., the argument value
needs to be an integer, numeric character or a character of the form
chrx, where x may be any possible string. The user has
to make sure that the respective chromosome is indeed defined for
the the track's genome. If not provided here, the constructor will
try to construct the chromosome information based on the available
inputs, and as a last resort will fall back to the value
chrNA. Please note that by definition all objects in the
Gviz package can only have a single active chromosome at a
time (although internally the information for more than one
chromosome may be present), and the user has to call the
chromosome<- replacement method in order to change to a
different active chromosome.
genome
The genome on which the track's ranges are
defined. Usually this is a valid UCSC genome identifier, however
this is not being formally checked at this point. If not provided
here the constructor will try to extract this information from the
provided input, and eventually will fall back to the default value
of NA.
stacking
The stacking type for overlapping items of the
track. One in c(hide, dense, squish, pack,full). Currently,
only squish (make best use of the available space), dense (no
stacking, collapse overlapping ranges), and hide (do not show any
track items at all) are implemented.
name
Character scalar of the track's name used in the title
panel when plotting.
fun
A function that is being called
for each entry in the AnnotationTrack object. See section
'Details' and 'Examples' for further information. When called
internally by the plotting machinery, a number of arguments are
automatically passed on to this function, and the user needs to make
sure that they can all be digested (i.e., either have all of them as
formal named function arguments, or gobble up everything that is not
needed in ...). These arguments are:
start: the genomic start coordinate of the range
item.
end: the genomic end coordinates of the range
item.
strand: the strand information for the range item.
chromosome: the chromosome of the range item.
identifier: the identifier of the range item, i.e.,
the result of calling identifier(DetailsAnnotationTrack,
lowest=TRUE). Typically those identifiers are passed on to
the object constructor during instantiation as the id
argument.
index: a counter enumerating the ranges. The
AnnotationTrack object is sorted internally for
visibility, and the index argument refers to the index
of plotting.
GdObject: a reference to the currently plotted
DetailsAnnotationTrack object.
GdObject.original: a reference to the
DetailsAnnotationTrack before any processing like item
collapsing has taken place. Essentially, this is the track
object as it exists in your working environment.
Additional arguments can be passed to the plotting function by means
of the detailsFunArgs argument (see below). Note that the
plot must use grid graphics (e.g. function in the 'lattice' package
or low-level grid functions). To access a data object such a matrix
or data frame within the function you can either store it as a
variable in the global environment or, to avoid name space
conflicts, you can make it part of the function environment by means
of a closure. Alternatively, you may want to explicitely stick it
into an environment or pass it along in the detailsFunArgs
list. To figure out in your custom plotting function which
annotation element is currently being plotted you can either use the
identifier which has to be unique for each range element, or you may
want to use the genomic position (start/end/strand/chromosome)
e.g. if the data is stored in a GRanges object.
selectFun
A function that is being called
for each entry in the AnnotationTrack object with exactly
the same arguments as in fun. The purpose of this function
is to decide for each track element whether details should be
drawn, and consequently it has to return a single logical
scalar. If the return value is TRUE, details will be drawn
for the item, if it is FALSE, the details strip for the
item is omitted.
importFunction
A user-defined function to be used to import the
data from a file. This only applies when the range argument
is a character string with the path to the input data file. The
function needs to accept an argument x containing the file
path and has to return a proper GRanges object with all the
necessary metadata columns set. A set of default
import functions is already implemented in the package for a number
of different file types, and one of these defaults will be picked
automatically based on the extension of the input file name. If the
extension can not be mapped to any of the existing import function,
an error is raised asking for a user-defined import function via
this argument. Currently the following file types can be imported
with the default functions: gff, gff1, gff2,
gff3, bed, bam.
stream
A logical flag indicating that the user-provided import
function can deal with indexed files and knows how to process the
additional selection argument when accessing the data on
disk. This causes the constructor to return a
ReferenceAnnotationTrack object which will grab the necessary data
on the fly during each plotting operation.
...
Additional items which will all be interpreted as further
display parameters. See settings and the "Display
Parameters" section below for details.
Value
The return value of the constructor function is a new object of class
AnnotationTrack or of class DetailsAnnotationTrack,
depending on the constructor arguments. Typically the user will not
have to be troubled with this distinction and can rely on the
constructor to make the right choice.
Objects from the class
Objects can be created using the constructor function
AnnotationTrack.
details
The DetailsAnnotationTrack class directly extends
AnnotationTrack. The purpose of this track type is to add an
arbitrarily detailed plot section (typically consisting of additional
quantitative data) for each range element of an
AnnotationTrack. This allows a locus wide view of annotation
elements together with any kind of details per feature or element that
may for instance provide insight on how some complex quantitative
measurements change accoring to their position in a locus. If the
quantitative data is too complex for a DataTrack e.g. because
it requires extra space or a trellis-like representation, a
DetailsAnnotationTrack can be used instead. Example: An
AnnotationTrack shows the positions of a number of probes from
a microarray, and you want a histogram of the signal intensity
distribution derived from all samples at each of these probe
location. Another example usage would be to show for each element of
an AnnotationTrack an xy-plot of the signal against some
clinical measurement such as blood preassure. The limitation for
applications of this type of track is basically only the available
space of the device you are plotting to.
This flexibility is possible by utilizing a simple function model to
perform all the detailed plotting. The functionality of this plotting
function fun is totally up to the user, and the function
environment is prepared in a way that all necessary information about
the plotted annotation feature is available. To restrict the details
section to only selected number of annotation features one can supply
another function selectFun, which decides for each feature
separatly whether details are available or not. Finally, an arbitrary
number of additional arguments can be passed on to these two function
by means of the detailsFunArgs display parameter. This is
expected to be a named list, and all list elements are passed along to
the plotting function fun and to the selector function
selectFun as additional named arguments. Please note that some
argument names like start, end or identifier are
reserved and can not be used in the detailsFunArgs list. For
examples of plotting functions, see the 'Examples' section.
Slots
stacking:
Object of class "character",
inherited from class StackedTrack
stacks:
Object of class "environment",
inherited from class StackedTrack
range:
Object of class GRanges,
inherited from class RangeTrack
chromosome:
Object of class "character",
inherited from class RangeTrack
genome:
Object of class "character", inherited
from class RangeTrack
dp:
Object of class
DisplayPars, inherited from class
GdObject
name:
Object of class "character", inherited
from class GdObject
imageMap:
Object of class
ImageMap, inherited from class
GdObject
fun:
A function that is being called for each
AnnotationTrack element to plot details.
selectFun:
A function that is being called for each
AnnotationTrack element to decide whether details need to
be plotted.
Additional display parameters are being inherited from the
StackedTrack parent class.
Extends
Class "StackedTrack", directly.
Class "RangeTrack", by class "StackedTrack", distance 2.
Class "GdObject", by class "StackedTrack",
distance3.
In the following code chunks, obj is considered to be an object
of class AnnotationTrack or DetailsAnnotationTrack.
Exported in the name space:
group
signature(GdObject="AnnotationTrack"): extract
the group membership for all track items.
Usage:
group(GdObject)
Examples:
group(obj)
group<-
signature(GdObject="AnnotationTrack",
      value="character")
: replace the grouping information for track
items. The replacement value must be a factor of appropriate
length or another vector that can be coerced into such.
Usage:
group<-(GdObject, value)
Examples:
group(obj) <- c("a", "a", "b", "c", "a")
identifier
signature(GdObject="AnnotationTrack"):
return track item identifiers. Depending on the setting of the
optional argument lowest, these are either the group
identifiers or the individual item identifiers.
Usage:
identifier(GdObject, lowest=FALSE)
Additional Arguments:
lowest: return the lowest-level identifier, i.e.,
the item IDs, or the higher level group IDs which do not have to
be unqiue.
Examples:
identifier(obj)
identifier(obj, lowest=TRUE)
identifier<-
signature(GdObject="AnnotationTrack",
	value="character")
: Set the track item identifiers. The
replacement value has to be a character vector of appropriate
length. This always replaces the group-level identifiers, so
essentially it is similar to groups<-.
Usage:
identifier<-(GdObject, value)
Examples:
identifier(obj) <- c("foo", "bar")
Internal methods:
coerce
signature(from="AnnotationTrack",
	to="UCSCData")
: coerce to a UCSCData object for export to
the UCSC genome browser.
Examples:
as(obj, "UCSCData")
collapseTrack
signature(GdObject="AnnotationTrack"):
preprocess the track before plotting. This will collapse
overlapping track items based on the available resolution and
increase the width and height of all track objects to a minimum
value to avoid rendering issues. See collapsing for
details.
diff: the minimum pixel width to display,
everything below that will be inflated to a width of
diff.
Examples:
Gviz:::collapseTrack(obj)
drawGD
signature(GdObject="AnnotationTrack"): plot the
object to a graphics device. The return value of this method is
the input object, potentially updated during the plotting
operation. Internally, there are two modes in which the method can
be called. Either in 'prepare' mode, in which case no plotting is
done but the object is preprocessed based on the
available space, or in 'plotting' mode, in which case the actual
graphical output is created. Since subsetting of the object can be
potentially costly, this can be switched off in case subsetting
has already been performed before or is not necessary.
prepare: run method in preparation or in
production mode.
subset: subset the object to the visible region
or skip the potentially expensive subsetting operation.
...: all further arguments are ignored.
Examples:
Gviz:::drawGD(obj)
Gviz:::drawGD(obj, minBase=1, maxBase=100)
Gviz:::drawGD(obj, prepare=TRUE,
	    subset=FALSE)
drawGrid
signature(GdObject="AnnotationTrack"): superpose a grid on top of a track.
Usage:
drawGrid(GdObject, from, to)
Additional Arguments:
from, to: integer scalars, draw grid
within a certain coordinates range. This needs to be supplied
for the plotting function to know the current genomic
coordinates.
Examples:
Gviz:::drawGrid(obj, from=10, to=100)
setStacks
signature(GdObject="AnnotationTrack"):
recompute the stacks based on the available space and on the
object's track items and stacking settings.
Usage:
setStacks(GdObject, from, to)
Additional Arguments:
from, to: integer scalars, compute
stacking within a certain coordinates range. This needs to be
supplied for the plotting function to know the current genomic
coordinates.
Examples:
Gviz:::setStacks(obj, from=1, to=100)
initialize
signature(.Object="AnnotationTrack"):
initialize the object
show
signature(object="AnnotationTrack"): show a
human-readable summary of the object
Inherited methods:
stacking
signature(GdObject="AnnotationTrack"): return
the current stacking type.
Usage:
stacking(GdObject)
Examples:
stacking(obj)
stacking<-
signature(GdObject="AnnotationTrack",
      value="character")
: set the object's stacking type to one in
c(hide, dense, squish, pack,full).
Usage:
stacking<-(GdObject, value)
Additional Arguments:
value: replacement value.
Examples:
stacking(obj) <- "squish"
stacks
signature(GdObject="AnnotationTrack"): return
the stack indices for each track item.
Usage:
stacks(GdObject)
Examples:
Gviz:::stacks(obj)
[
signature(x="AnnotationTrack", i="ANY", j="ANY",
	drop="ANY")
: subset the items in the AnnotationTrack
object. This is essentially similar to subsetting of the
GRanges object in the range
slot. For most applications, the subset method may be
more appropriate.
Additional Arguments:
i, j: subsetting indices, j is
ignored.
drop: argument is ignored.
Examples:
obj[1:5]
chromosome
signature(GdObject="AnnotationTrack"):
return the currently active chromosome for which the track is
defined. For consistancy with other Bioconductor packages, the
isActiveSeq alias is also provided.
Usage:
chromosome(GdObject)
Examples:
chromosome(obj)
chromosome<-
signature(GdObject="AnnotationTrack"):
replace the value of the track's active chromosome. This has to
be a valid UCSC chromosome identifier or an integer or character
scalar that can be reasonably coerced into one, unless
options(ucscChromosomeNames=FALSE). For consistancy with
other Bioconductor packages, the isActiveSeq<- alias is
also provided.
Usage:
chromosome<-(GdObject, value)
Additional Arguments:
value: replacement value.
Examples:
chromosome(obj) <- "chr12"
start, end, width
signature(x="AnnotationTrack"): the
start or end coordinates of the track items, or their width in
genomic coordinates.
Usage:
start(x)
end(x)
width(x)
Examples:
start(obj)
end(obj)
width(obj)
start<-, end<-, width<-
signature(x="AnnotationTrack"):
replace the start or end coordinates of the track items, or their
width.
Usage:
start<-(x, value)
end<-(x, value)
width<-(x, value)
Additional Arguments:
value: replacement value.
Examples:
start(obj) <- 1:10
end(obj) <- 20:30
width(obj) <- 1
position
signature(GdObject="AnnotationTrack"): the
arithmetic mean of the track item's coordionates, i.e.,
(end(obj)-start(obj))/2.
Usage:
position(GdObject)
Examples:
position(obj)
feature
signature(GdObject="AnnotationTrack"): return the
grouping information for track items. For certain sub-classes,
groups may be indicated by different color schemes when
plotting. See grouping for details.
Usage:
feature(GdObject)
Examples:
feature(obj)
feature<-
signature(gdObject="AnnotationTrack",
      value="character")
: set the grouping information for track
items. This has to be a factor vector (or another type of vector
that can be coerced into one) of the same length as the number of
items in the AnnotationTrack. See grouping
for details.
Usage:
feature<-(GdObject, value)
Additional Arguments:
value: replacement value.
Examples:
feature(obj) <- c("a", "a", "b", "c", "a")
genome
signature(x="AnnotationTrack"): return the track's genome.
Usage:
genome(x)
Examples:
genome(obj)
genome<-
signature(x="AnnotationTrack"): set the track's
genome. Usually this has to be a valid UCSC identifier, however
this is not formally enforced here.
Usage:
genome<-(x, value)
Additional Arguments:
value: replacement value.
Examples:
genome(obj) <- "mm9"
length
signature(x="AnnotationTrack"): return the number
of items in the track.
Usage:
length(x)
Examples:
length(obj)
range
signature(x="AnnotationTrack"): return the genomic
coordinates for the track as an object of class
IRanges.
Usage:
range(x)
Examples:
range(obj)
ranges
signature(x="AnnotationTrack"): return the genomic
coordinates for the track along with all additional annotation
information as an object of class GRanges.
Usage:
ranges(x)
Examples:
ranges(obj)
split
signature(x="AnnotationTrack"): split a
AnnotationTrack object by an appropriate factor vector (or
another vector that can be coerced into one). The output of this
operation is a list of objects of the same class as the input
object, all inheriting from class AnnotationTrack.
Usage:
split(x, f, ...)
Additional Arguments:
f: the splitting factor.
...: all further arguments are ignored.
Examples:
split(obj, c("a", "a", "b", "c", "a"))
strand
signature(x="AnnotationTrack"): return a vector of
strand specifiers for all track items, in the form '+' for the
Watson strand, '-' for the Crick strand or '*' for either of the
two.
Usage:
strand(x)
Examples:
strand(obj)
strand<-
signature(x="AnnotationTrack"): replace the
strand information for the track items. The replacement value
needs to be an appropriate scalar or vector of strand values.
Usage:
strand<-(x, value)
Additional Arguments:
value: replacement value.
Examples:
strand(obj) <- "+"
values
signature(x="AnnotationTrack"): return all
additional annotation information except for the genomic coordinates
for the track items as a data.frame.
Usage:
values(x)
Examples:
values(obj)
coerce
signature(from="AnnotationTrack",
	to="data.frame")
: coerce the GRanges
object in the range slot into a regular data.frame.
Examples:
as(obj, "data.frame")
subset
signature(x="AnnotationTrack"): subset a
AnnotationTrack by coordinates and sort if necessary.
Usage:
subset(x, from, to, sort=FALSE, ...)
Additional Arguments:
from, to: the coordinates range to subset
to.
sort: sort the object after subsetting. Usually
not necessary.
...: additional arguments are ignored.
Examples:
subset(obj, from=10, to=20, sort=TRUE)
displayPars
signature(x="AnnotationTrack",
      name="character")
: list the value of the display parameter
name. See settings for details on display
parameters and customization.
Usage:
displayPars(x, name)
Examples:
displayPars(obj, "col")
displayPars
signature(x="AnnotationTrack",
      name="missing")
: list the value of all available display
parameters. See settings for details on display
parameters and customization.
Examples:
displayPars(obj)
getPar
signature(x="AnnotationTrack", name="character"):
alias for the displayPars method. See
settings for details on display parameters and
customization.
Usage:
getPar(x, name)
Examples:
getPar(obj, "col")
getPar
signature(x="AnnotationTrack", name="missing"):
alias for the displayPars method. See
settings for details on display parameters and
customization.
Examples:
getPar(obj)
displayPars<-
signature(x="AnnotationTrack",
      value="list")
: set display parameters using the values of the
named list in value. See settings for details
on display parameters and customization.
Usage:
displayPars<-(x, value)
Examples:
displayPars(obj) <- list(col="red", lwd=2)
setPar
signature(x="AnnotationTrack", value="character"):
set the single display parameter name to value. Note
that display parameters in the AnnotationTrack class are
pass-by-reference, so no re-assignmnet to the symbol obj is
necessary. See settings for details on display
parameters and customization.
Usage:
setPar(x, name, value)
Additional Arguments:
name: the name of the display parameter to set.
Examples:
setPar(obj, "col", "red")
setPar
signature(x="AnnotationTrack", value="list"): set
display parameters by the values of the named list in
value. Note that display parameters in the
AnnotationTrack class are pass-by-reference, so no
re-assignmnet to the symbol obj is necessary. See
settings for details on display parameters and
customization.
Examples:
setPar(obj, list(col="red", lwd=2))
names
signature(x="AnnotationTrack"): return the value of
the name slot.
Usage:
names(x)
Examples:
names(obj)
names<-
signature(x="AnnotationTrack", value="character"):
set the value of the name slot.
Usage:
names<-(x, value)
Examples:
names(obj) <- "foo"
coords
signature(ImageMap="AnnotationTrack"): return the
coordinates from the internal image map.
Usage:
coords(ImageMap)
Examples:
coords(obj)
tags
signature(x="AnnotationTrack"): return the tags from the
internal image map.
Usage:
tags(x)
Examples:
tags(obj)
Display Parameters
The following display parameters are set for objects of class
AnnotationTrack upon instantiation, unless one or more of them
have already been set by one of the optional sub-class initializers,
which always get precedence over these global defaults. See
settings for details on setting graphical parameters
for tracks.
cex=1: Numeric scalar. The font expansion factor
for item identifiers.
cex.group=0.6: Numeric scalar. The font expansion
factor for the group-level annotation.
col="transparent": Character or integer scalar. The
border color for all track items.
col.line="darkgray": Character scalar. The color used for
connecting lines between grouped items. Defaults to a dark gray,
but if set to NULL the same color as for the first item in
the group is used.
fill="lightblue": Character or integer scalar. The
fill color for untyped items. This is also used to connect grouped
items. See grouping for details.
fontcolor="white": Character or integer scalar. The
font color for item identifiers.
fontcolor.group="#808080": Character or integer
scalar. The font color for the group-level annotation.
fontface=1: Integer scalar. The font face for item
identifiers.
fontface.group=2: Numeric scalar. The font face for
the group-level annotation.
fontfamily="sans": Character scalar. The font family
for item identifiers.
fontsize=12: Numeric scalar. The font size for item
identifiers.
lex=1: Numeric scalar. The line expansion factor
for all track items. This is also used to connect grouped items.
See grouping for details.
lineheight=1: Numeric scalar. The font line height
for item identifiers.
lty="solid": Character or integer scalar. The line
type for all track items. This is also used to connect grouped
items. See grouping for details.
lwd=1: Integer scalar. The line width for all track
items. This is also used to connect grouped items. See
grouping for details.
rotation=0: Numeric scalar. The degree of text
rotation for item identifiers.
shape="arrow": Character scalar. The shape in which
to display the track items. Currently only box, arrow,
ellipse, and smallArrow are implemented.
showFeatureId=FALSE: Logical scalar. Control whether
to plot the individual track item identifiers.
showId=FALSE: Logical scalar. Control whether to
annotate individual groups.
showOverplotting=FALSE: Logical scalar. Use a color
gradient to show the amount of overplotting for collapsed items.
This implies that collapse==TRUE
size=1: Numeric scalar. The relative size of the
track. Can be overridden in the plotTracks
function.
mergeGroups=FALSE: Logical scalar. Merge fully
overlapping groups if collapse==TRUE.
DetailsAnnotationTrack adds the following additional display parameters:
details.size=0.5: Numeric scalar. The fraction of
vertical space of the track used for the details section.
details.minWidth=100: Numeric scalar. The minium
width in pixels for a details panel, if less space is available no
details are plotted.
detailsConnector.col="darkgray": Character or integer
scalar. Color of the line connecting the AnnotstionTrack
item with its details panel.
detailsConnector.lty="dashed": Character or integer
scalar. Type of connecting line.
detailsConnector.lwd=1: Integer scalar. Line width of
the connector.
detailsConnector.pch=20: Integer scalar. Type of the
connector's ends.
detailsConnector.cex=1: Numeric scalar. Relative size
of the connector's end points.
detailsBorder.lty="solid": Character or integer
scalar. Line type of the border around each details panel.
detailsBorder.lwd=1: Integer scalar. Line width of
the border.
detailsBorder.col="darkgray": Character or integer
scalar. Line color of the border.
detailsBorder.fill="transparent": Character or
integer scalar. Background color of the border.
details.ratio=Inf: Numeric scalar. By default, the
plotting method tries to fill all available space of the details
panel tiles. Depending on the dimensions of your plot and the
number of tiles this may lead to fairly stretched
plots. Restricting the ration of width over height can help to
fine tune for somewhat more sane graphics in these
cases. Essentially this adds some white space in between
individual tiles to force the desired ratio. Together with the
size and details.size arguments, which control the
vertical extension of the whole track and of the details section,
this allows for some fairly generic resizing of the tiles.
detailsFunArgs=list(): List. Additional arguments that
get passed on the the details plotting function.
groupDetails=FALSE: Logial scalar. Plot details for
feature groups rather than for individual features.
Additional display parameters are being inherited from the respective
parent classes. Note that not all of them may have an effect on the
plotting of AnnotationTrackDetailsAnnotationTrack objects.
StackedTrack:
reverseStacking=FALSE: Logical flag. Reverse the
y-ordering of stacked items. I.e., features that are plotted on
the bottom-most stacks will be moved to the top-most stack and
vice versa.
stackHeight=0.75: Numeric between 0 and 1. Controls
the vertical size and spacing between stacked elements. The number
defines the proportion of the total available space for the stack
that is used to draw the glyphs. E.g., a value of 0.5 means that
half of the available vertical drawing space (for each stacking
line) is used for the glyphs, and thus one quarter of the available
space each is used for spacing above and below the glyph. Defaults
to 0.75.
GdObject:
alpha=1: Numeric scalar. The transparency for
all track items.
background.panel="transparent": Integer or
character scalar. The background color of the content panel.
background.title="lightgray": Integer or character
scalar. The background color for the title panels.
col.border.title="transparent": Integer or character
scalar. The border color for the title panels.
lwd.border.title=1: Integer scalar. The border
width for the title panels.
cex.axis=NULL: Numeric scalar. The expansion
factor for the axis annotation. Defaults to NULL, in
which case it is computed based on the available space.
cex.title=NULL: Numeric scalar. The expansion
factor for the title panel. This effects the fontsize of both
the title and the axis, if any. Defaults to NULL,
which means that the text size is automatically adjusted to
the available space.
col.axis="white": Integer or character scalar.
The font and line color for the y axis, if any.
col.frame="lightgray": Integer or character
scalar. The line color used for the panel frame, if
frame==TRUE
col.grid="#808080": Integer or character scalar.
Default line color for grid lines, both when type=="g"
in DataTracks and when display parameter
grid==TRUE.
col.symbol=NULL: Integer or character scalar.
Default colors for plot symbols. Usually the same as the
global col parameter.
col.title="white": Integer or character scalar.
The font color for the title panels.
collapse=TRUE: Boolean controlling wether to
collapse the content of the track to accomodate the minimum
current device resolution. See collapsing for
details.
fontface.title=2: Integer or character scalar.
The font face for the title panels.
fontfamily.title="sans": Integer or character
scalar. The font family for the title panels.
frame=FALSE: Boolean. Draw a frame around the
track when plotting.
grid=FALSE: Boolean, switching on/off the plotting
of a grid.
h=-1: Integer scalar. Parameter controlling the
number of horizontal grid lines, see panel.grid
for details.
lty.grid="solid": Integer or character scalar.
Default line type for grid lines, both when type=="g"
in DataTracks and when display parameter
grid==TRUE.
lwd.grid=1: Numeric scalar. Default line width
for grid lines, both when type=="g" in DataTracks
and when display parameter grid==TRUE.
min.distance=1: Numeric scalar. The minimum
pixel distance before collapsing range items, only if
collapse==TRUE. See collapsing for details.
min.height=3: Numeric scalar. The minimum range
height in pixels to display. All ranges are expanded to this
size in order to avoid rendering issues. See
collapsing for details. For feathered bars
indicating the strandedness of grouped items this also
controls the height of the arrow feathers.
min.width=1: Numeric scalar. The minimum range
width in pixels to display. All ranges are expanded to this
size in order to avoid rendering issues. See collapsing
for details.
showAxis=TRUE: Boolean controlling whether to
plot a y axis (only applies to track types where axes are
implemented).
showTitle=TRUE: Boolean controlling whether to
plot a title panel. Although this can be set individually
for each track, in multi-track plots as created by
plotTracks there will still be an empty
placeholder in case any of the other tracks include a title.
The same holds true for axes. Note that the the title panel
background color could be set to transparent in order to
completely hide it.
v=-1: Integer scalar. Parameter controlling the
number of vertical grid lines, see panel.grid
for details.
Author(s)
Florian Hahne, Arne Mueller
See Also
DisplayPars
GdObject
GRanges
ImageMap
IRanges
RangeTrack
StackedTrack
collapsing
DataTrack
grouping
panel.grid
plotTracks
settings
Examples
## An empty object
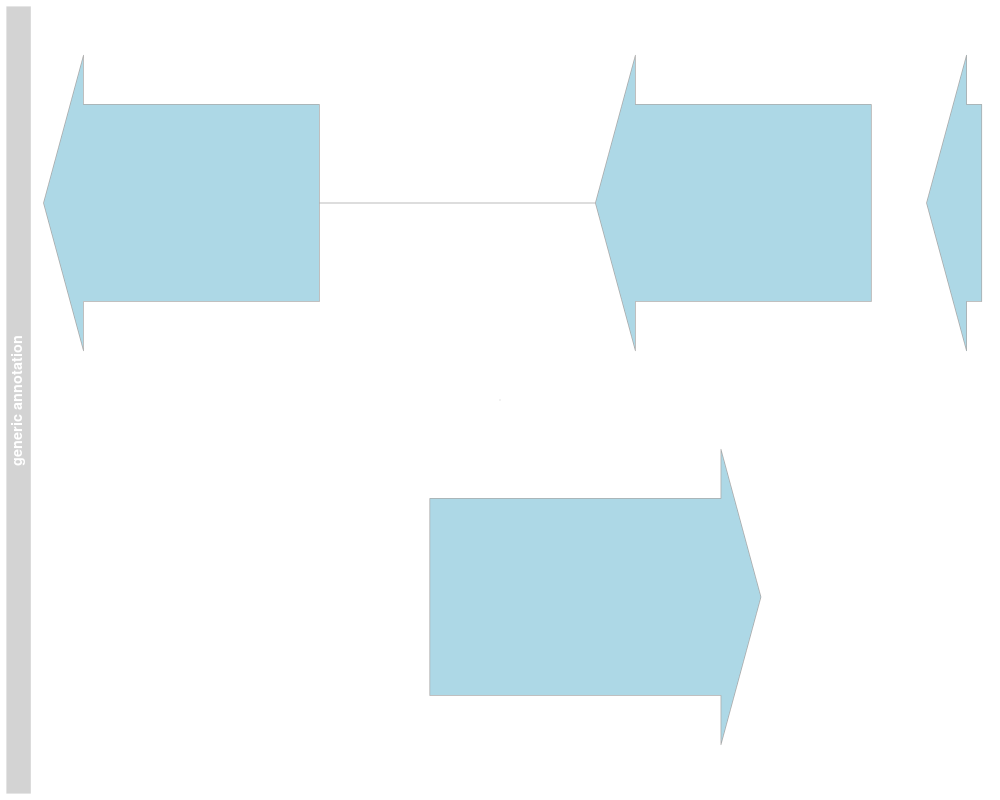
AnnotationTrack()
## Construct from individual arguments
st <- c(2000000, 2070000, 2100000, 2160000)
ed <- c(2050000, 2130000, 2150000, 2170000)
str <- c("-", "+", "-", "-")
gr <- c("Group1","Group2","Group1", "Group3")
annTrack <- AnnotationTrack(start=st, end=ed, strand=str, chromosome=7, genome="hg19", feature="test",
group=gr, id=paste("annTrack item", 1:4), name="generic annotation", stacking="squish")
## Or from a data.frame
df <- data.frame(start=st, end=ed, strand=str, id=paste("annTrack item", 1:4), feature="test",
group=gr)
annTrack <- AnnotationTrack(range=df, genome="hg19", chromosome=7, name="generic annotation",
stacking="squish")
## Or from a GRanges object
gr <- GRanges(seqnames="chr7", range=IRanges(start=df$start, end=df$end), strand=str)
genome(gr) <- "hg19"
mcols(gr) <- df[,-(1:3)]
annTrack <- AnnotationTrack(range=gr, name="generic annotation", stacking="squish")
## Finally from a GRangesList
grl <- split(gr, values(gr)$group)
AnnotationTrack(grl)
## Plotting
plotTracks(annTrack)
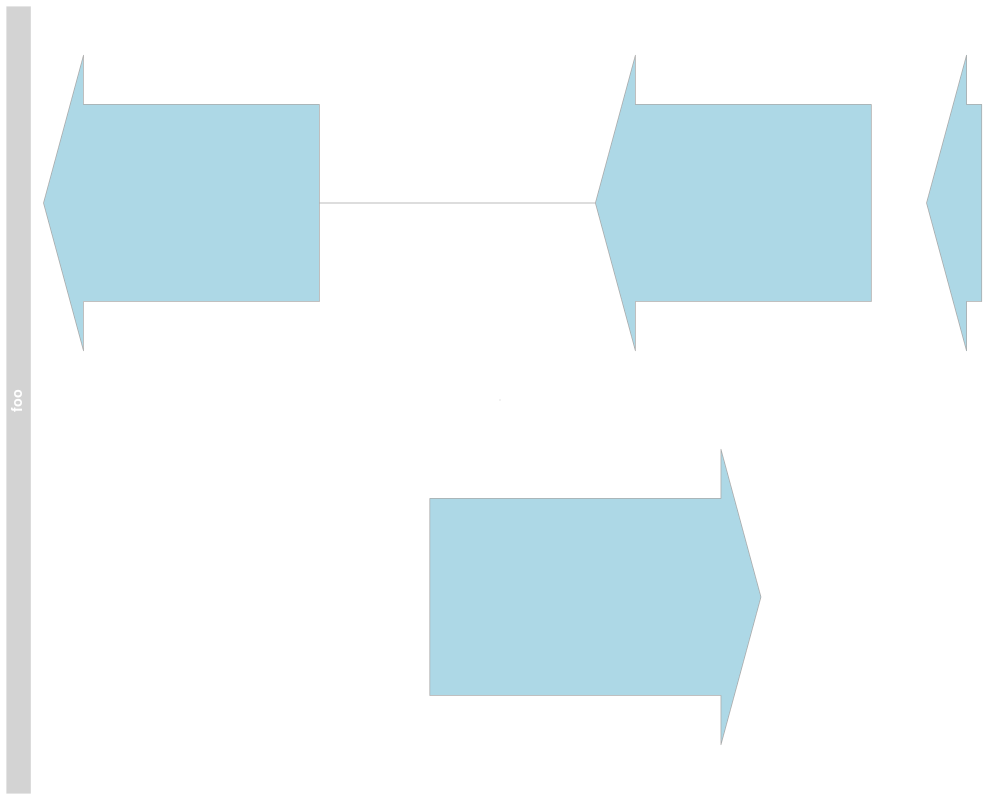
## Track names
names(annTrack)
names(annTrack) <- "foo"
plotTracks(annTrack)
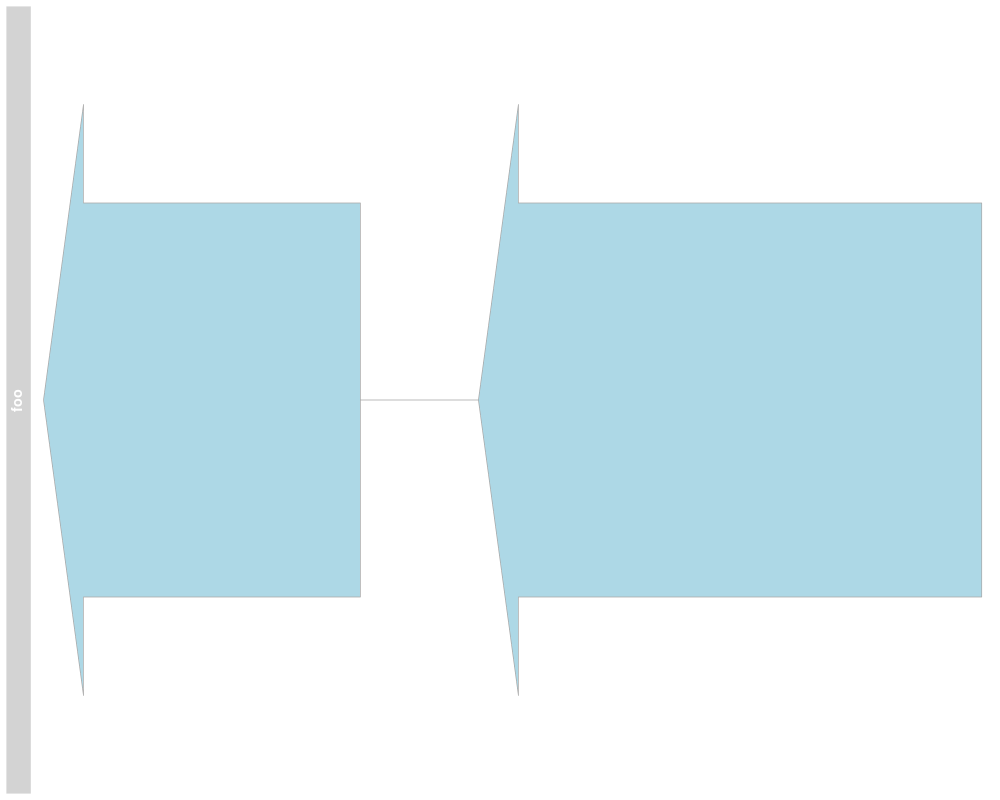
## Subsetting and splitting
subTrack <- subset(annTrack, to=2155000)
length(subTrack)
subTrack[1:2]
split(annTrack, c(1,2,1,2))
## Accessors
start(annTrack)
end(annTrack)
width(annTrack)
position(annTrack)
width(subTrack) <- width(subTrack)+1000
strand(annTrack)
strand(subTrack) <- "-"
chromosome(annTrack)
chromosome(subTrack) <- "chrX"
genome(annTrack)
genome(subTrack) <- "mm9"
range(annTrack)
ranges(annTrack)
## Annotation
identifier(annTrack)
identifier(annTrack, "lowest")
identifier(subTrack) <- "bar"
feature(annTrack)
feature(subTrack) <- "foo"
values(annTrack)
## Grouping
group(annTrack)
group(subTrack) <- "Group 1"
chromosome(subTrack) <- "chr7"
plotTracks(subTrack)
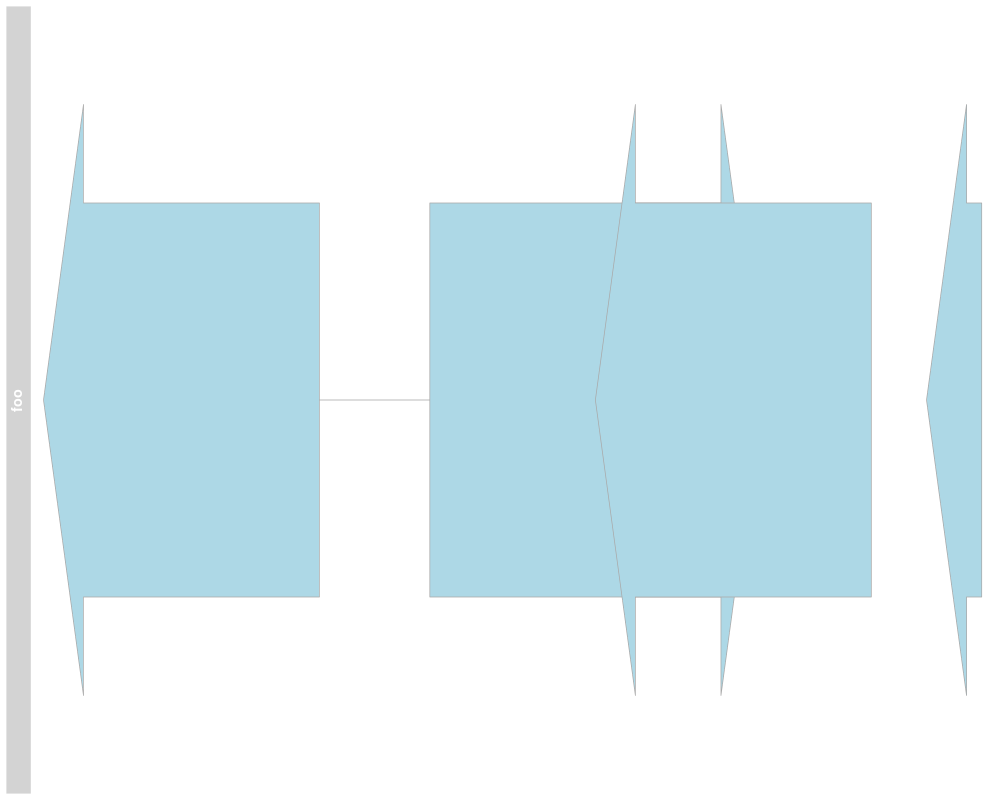
## Stacking
stacking(annTrack)
stacking(annTrack) <- "dense"
plotTracks(annTrack)
## coercion
as(annTrack, "data.frame")
as(annTrack, "UCSCData")
## HTML image map
coords(annTrack)
tags(annTrack)
annTrack <- plotTracks(annTrack)$foo
coords(annTrack)
tags(annTrack)
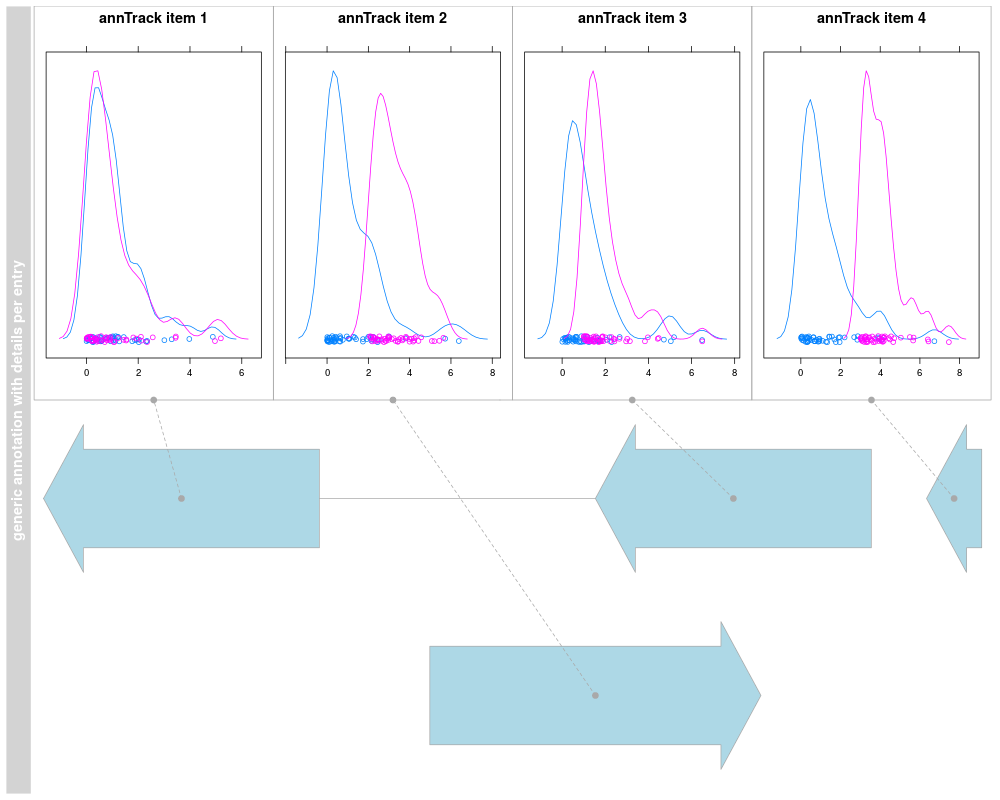
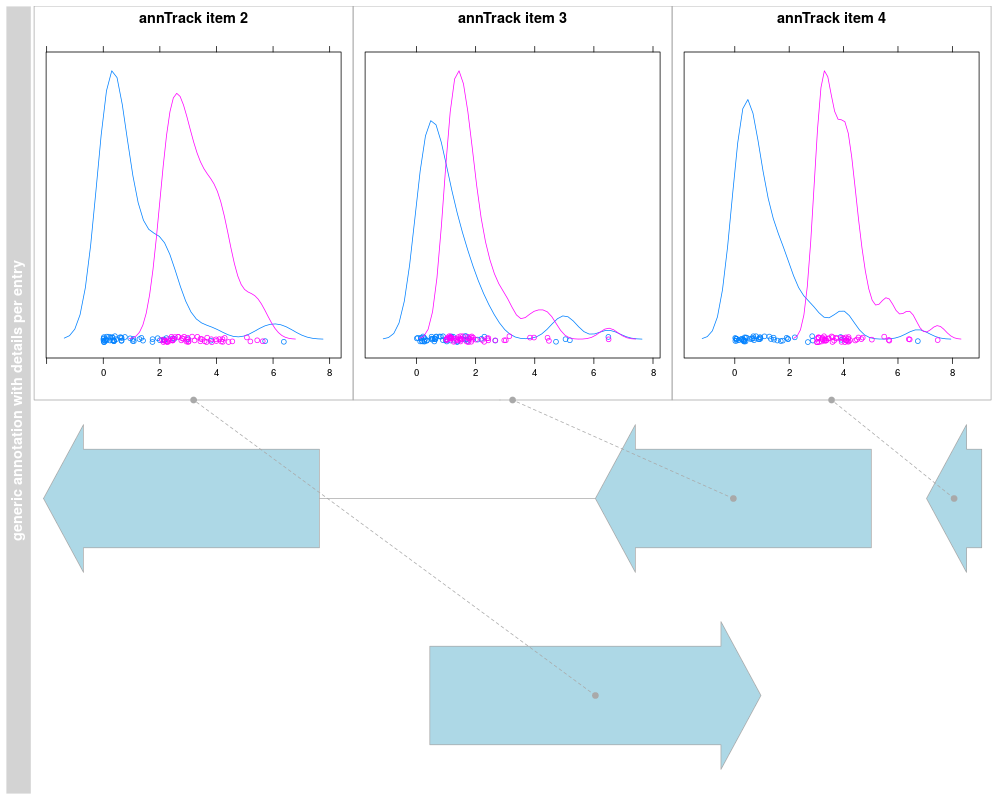
## DetailsAnnotationTrack
library(lattice) # need to use grid grapics
## generate two random distributions per row (probe/feature)
## the difference between the distributions increases from probe 1 to 4
m <- matrix(c(rgamma(400, 1)), ncol=100)
m[,51:100] <- m[,51:100] + 0:3
## rownames must be accessible by AnnotationTrack element identifier
rownames(m) <- identifier(annTrack, "lowest")
## create a lattice density plot for the values (signals) of the two groups
## as the chart must be placed into a pre-set grid view port we have to use
## print without calling plot.new! Note, use a common prefix for all lattice.
## Avoid wasting space by removing y-axis decorations.
## Note, in this example 'm' will be found in the environment the 'details'
## function is defined in. To avoid overwriting 'm' you should use a closure
## or environment to access 'm'.
details <- function(identifier, ...) {
d = data.frame(signal=m[identifier,], group=rep(c("grp1","grp2"), each=50))
print(densityplot(~signal, group=group, data=d, main=identifier,
scales=list(draw=FALSE, x=list(draw=TRUE)), ylab="", xlab="",
), newpage=FALSE, prefix="plot")
}
deTrack <- AnnotationTrack(range=gr, genome="hg19", chromosome=7,
name="generic annotation with details per entry", stacking="squish",
fun=details, details.ratio=1)
plotTracks(deTrack)
set.seed(1234)
deTrack <- AnnotationTrack(range=gr, genome="hg19", chromosome=7,
name="generic annotation with details per entry",
stacking="squish",fun=details,
details.ratio=1, selectFun=function(...){sample(c(FALSE, TRUE), 1)})
plotTracks(deTrack)
Results
R version 3.3.1 (2016-06-21) -- "Bug in Your Hair"
Copyright (C) 2016 The R Foundation for Statistical Computing
Platform: x86_64-pc-linux-gnu (64-bit)

R is free software and comes with ABSOLUTELY NO WARRANTY.
You are welcome to redistribute it under certain conditions.
Type 'license()' or 'licence()' for distribution details.

R is a collaborative project with many contributors.
Type 'contributors()' for more information and
'citation()' on how to cite R or R packages in publications.

Type 'demo()' for some demos, 'help()' for on-line help, or
'help.start()' for an HTML browser interface to help.
Type 'q()' to quit R.

> library(Gviz)
Loading required package: S4Vectors
Loading required package: stats4
Loading required package: BiocGenerics
Loading required package: parallel

Attaching package: 'BiocGenerics'

The following objects are masked from 'package:parallel':

    clusterApply, clusterApplyLB, clusterCall, clusterEvalQ,
    clusterExport, clusterMap, parApply, parCapply, parLapply,
    parLapplyLB, parRapply, parSapply, parSapplyLB

The following objects are masked from 'package:stats':

    IQR, mad, xtabs

The following objects are masked from 'package:base':

    Filter, Find, Map, Position, Reduce, anyDuplicated, append,
    as.data.frame, cbind, colnames, do.call, duplicated, eval, evalq,
    get, grep, grepl, intersect, is.unsorted, lapply, lengths, mapply,
    match, mget, order, paste, pmax, pmax.int, pmin, pmin.int, rank,
    rbind, rownames, sapply, setdiff, sort, table, tapply, union,
    unique, unsplit


Attaching package: 'S4Vectors'

The following objects are masked from 'package:base':

    colMeans, colSums, expand.grid, rowMeans, rowSums

Loading required package: IRanges
Loading required package: GenomicRanges
Loading required package: GenomeInfoDb
Loading required package: grid
> png(filename="/home/ddbj/snapshot/RGM3/R_BC/result/Gviz/AnnotationTrack-class.Rd_%03d_medium.png", width=480, height=480)
> ### Name: AnnotationTrack-class
> ### Title: AnnotationTrack class and methods
> ### Aliases: AnnotationTrack-class AnnotationTrack
> ###   DetailsAnnotationTrack-class DetailsAnnotationTrack
> ###   initialize,DetailsAnnotationTrack-method
> ###   initialize,ReferenceAnnotationTrack-method
> ###   coerce,AnnotationTrack,UCSCData-method
> ###   collapseTrack,AnnotationTrack-method drawGD,AnnotationTrack-method
> ###   drawGrid,AnnotationTrack-method group group,AnnotationTrack-method
> ###   group<- group<-,AnnotationTrack,character-method
> ###   identifier,AnnotationTrack-method
> ###   identifier<-,AnnotationTrack,character-method identifier identifier<-
> ###   initialize,AnnotationTrack-method setStacks,AnnotationTrack-method
> ###   show,AnnotationTrack-method show,ReferenceAnnotationTrack-method
> ###   subset,AnnotationTrack-method subset,ReferenceAnnotationTrack-method
> ###   coerce,GRanges,AnnotationTrack-method
> ###   coerce,GRangesList,AnnotationTrack-method
> ###   consolidateTrack,AnnotationTrack-method
> ### Keywords: classes
>
> ### ** Examples
>
> ## An empty object
> AnnotationTrack()
AnnotationTrack 'AnnotationTrack'
| genome: NA
| active chromosome: chrNA
| annotation features: 0
>
> ## Construct from individual arguments
> st <- c(2000000, 2070000, 2100000, 2160000)
> ed <- c(2050000, 2130000, 2150000, 2170000)
> str <- c("-", "+", "-", "-")
> gr <- c("Group1","Group2","Group1", "Group3")
>
> annTrack <- AnnotationTrack(start=st, end=ed, strand=str, chromosome=7, genome="hg19", feature="test",
+                             group=gr, id=paste("annTrack item", 1:4), name="generic annotation", stacking="squish")
>
> ## Or from a data.frame
> df <- data.frame(start=st, end=ed, strand=str, id=paste("annTrack item", 1:4), feature="test",
+                  group=gr)
> annTrack <- AnnotationTrack(range=df, genome="hg19", chromosome=7, name="generic annotation",
+                              stacking="squish")
>
> ## Or from a GRanges object
> gr <- GRanges(seqnames="chr7", range=IRanges(start=df$start, end=df$end), strand=str)
> genome(gr) <- "hg19"
> mcols(gr) <- df[,-(1:3)]
> annTrack <- AnnotationTrack(range=gr, name="generic annotation", stacking="squish")
>
> ## Finally from a GRangesList
> grl <- split(gr, values(gr)$group)
> AnnotationTrack(grl)
AnnotationTrack 'AnnotationTrack'
| genome: hg19
| active chromosome: chr7
| annotation features: 4
>
> ## Don't show:
> ## For some annoying reason the postscript device does not know about
> ## the sans font
> #if(!interactive())
> #{
> font <- ps.options()$family
> displayPars(annTrack) <- list(fontfamily=font, fontfamily.title=font)
> #}
> ## End(Don't show)
>
> ## Plotting
> plotTracks(annTrack)
>
> ## Track names
> names(annTrack)
[1] "generic annotation"
> names(annTrack) <- "foo"
> plotTracks(annTrack)
>
> ## Subsetting and splitting
> subTrack <- subset(annTrack, to=2155000)
> length(subTrack)
[1] 3
> subTrack[1:2]
AnnotationTrack 'foo'
| genome: hg19
| active chromosome: chr7
| annotation features: 2
> split(annTrack, c(1,2,1,2))
$`1`
AnnotationTrack 'foo'
| genome: hg19
| active chromosome: chr7
| annotation features: 2

$`2`
AnnotationTrack 'foo'
| genome: hg19
| active chromosome: chr7
| annotation features: 2

>
> ## Accessors
> start(annTrack)
[1] 2000000 2070000 2100000 2160000
> end(annTrack)
[1] 2050000 2130000 2150000 2170000
> width(annTrack)
[1] 50001 60001 50001 10001
> position(annTrack)
[1] 2025000 2100000 2125000 2165000
> width(subTrack) <- width(subTrack)+1000
>
> strand(annTrack)
[1] "-" "+" "-" "-"
> strand(subTrack) <- "-"
>
> chromosome(annTrack)
[1] "chr7"
> chromosome(subTrack) <- "chrX"
>
> genome(annTrack)
  chr7
"hg19"
> genome(subTrack) <- "mm9"
>
> range(annTrack)
IRanges object with 4 ranges and 0 metadata columns:
          start       end     width
      <integer> <integer> <integer>
  [1]   2000000   2050000     50001
  [2]   2070000   2130000     60001
  [3]   2100000   2150000     50001
  [4]   2160000   2170000     10001
> ranges(annTrack)
GRanges object with 4 ranges and 4 metadata columns:
      seqnames             ranges strand |  feature       group              id
         <Rle>          <IRanges>  <Rle> | <factor> <character>        <factor>
  [1]     chr7 [2000000, 2050000]      - |     test      Group1 annTrack item 1
  [2]     chr7 [2070000, 2130000]      + |     test      Group2 annTrack item 2
  [3]     chr7 [2100000, 2150000]      - |     test      Group1 annTrack item 3
  [4]     chr7 [2160000, 2170000]      - |     test      Group3 annTrack item 4
        density
      <numeric>
  [1]         1
  [2]         1
  [3]         1
  [4]         1
  -------
  seqinfo: 1 sequence from hg19 genome; no seqlengths
>
> ## Annotation
> identifier(annTrack)
[1] "Group1" "Group2" "Group1" "Group3"
> identifier(annTrack, "lowest")
[1] "annTrack item 1" "annTrack item 2" "annTrack item 3" "annTrack item 4"
> identifier(subTrack) <- "bar"
>
> feature(annTrack)
[1] "test" "test" "test" "test"
> feature(subTrack) <- "foo"
>
> values(annTrack)
  feature  group              id density
1    test Group1 annTrack item 1       1
2    test Group2 annTrack item 2       1
3    test Group1 annTrack item 3       1
4    test Group3 annTrack item 4       1
>
> ## Grouping
> group(annTrack)
[1] "Group1" "Group2" "Group1" "Group3"
> group(subTrack) <- "Group 1"
> chromosome(subTrack) <- "chr7"
> plotTracks(subTrack)
>
> ## Stacking
> stacking(annTrack)
[1] "squish"
> stacking(annTrack) <- "dense"
> plotTracks(annTrack)
>
> ## coercion
> as(annTrack, "data.frame")
  X.seqnames X.start   X.end X.width X.strand X.feature X.group            X.id
1       chr7 2000000 2050000   50001        -      test  Group1 annTrack item 1
2       chr7 2070000 2130000   60001        +      test  Group2 annTrack item 2
3       chr7 2100000 2150000   50001        -      test  Group1 annTrack item 3
4       chr7 2160000 2170000   10001        -      test  Group3 annTrack item 4
  X.density feature  group              id density
1         1    test Group1 annTrack item 1       1
2         1    test Group2 annTrack item 2       1
3         1    test Group1 annTrack item 3       1
4         1    test Group3 annTrack item 4       1
> as(annTrack, "UCSCData")
UCSC track 'foo'
UCSCData object with 4 ranges and 3 metadata columns:
      seqnames             ranges strand |              id            name
         <Rle>          <IRanges>  <Rle> |     <character>     <character>
  [1]     chr7 [2000000, 2050000]      - | annTrack_item_1 annTrack_item_1
  [2]     chr7 [2070000, 2130000]      + | annTrack_item_2 annTrack_item_2
  [3]     chr7 [2100000, 2150000]      - | annTrack_item_3 annTrack_item_3
  [4]     chr7 [2160000, 2170000]      - | annTrack_item_4 annTrack_item_4
          itemRgb
      <character>
  [1]   lightblue
  [2]   lightblue
  [3]   lightblue
  [4]   lightblue
  -------
  seqinfo: 1 sequence from an unspecified genome; no seqlengths
>
> ## HTML image map
> coords(annTrack)
NULL
> tags(annTrack)
NULL
> annTrack <- plotTracks(annTrack)$foo
> coords(annTrack)
                       x1   y1       x2    y2
annTrack item 1  38.31359 64.5 164.3644 415.5
annTrack item 3 290.41525 64.5 416.4661 415.5
annTrack item 2 214.78475 64.5 366.0457 415.5
annTrack item 4 441.67625 64.5 466.8864 415.5
> tags(annTrack)
$fill
annTrack item 1 annTrack item 3 annTrack item 2 annTrack item 4
    "lightblue"     "lightblue"     "lightblue"     "lightblue"

$strand
annTrack item 1 annTrack item 3 annTrack item 2 annTrack item 4
            "-"             "-"             "+"             "-"

$text
  annTrack item 1   annTrack item 3   annTrack item 2   annTrack item 4
"annTrack item 1" "annTrack item 3" "annTrack item 2" "annTrack item 4"

$start
annTrack item 1 annTrack item 3 annTrack item 2 annTrack item 4
      "2000000"       "2100000"       "2070000"       "2160000"

$end
annTrack item 1 annTrack item 3 annTrack item 2 annTrack item 4
      "2050000"       "2150000"       "2130000"       "2170000"

$feature
annTrack item 1 annTrack item 3 annTrack item 2 annTrack item 4
         "test"          "test"          "test"          "test"

$group
annTrack item 1 annTrack item 3 annTrack item 2 annTrack item 4
       "Group1"        "Group1"        "Group2"        "Group3"

$id
  annTrack item 1   annTrack item 3   annTrack item 2   annTrack item 4
"annTrack item 1" "annTrack item 3" "annTrack item 2" "annTrack item 4"

$density
annTrack item 1 annTrack item 3 annTrack item 2 annTrack item 4
            "1"             "1"             "1"             "1"

$exonId
  annTrack item 1   annTrack item 3   annTrack item 2   annTrack item 4
"annTrack item 1" "annTrack item 3" "annTrack item 2" "annTrack item 4"

$origExonId
  annTrack item 1   annTrack item 3   annTrack item 2   annTrack item 4
"annTrack item 1" "annTrack item 3" "annTrack item 2" "annTrack item 4"

$col
annTrack item 1 annTrack item 3 annTrack item 2 annTrack item 4
     "darkgray"      "darkgray"      "darkgray"      "darkgray"

$title
[1] "Group1" "Group1" "Group2" "Group3"

>
> ## DetailsAnnotationTrack
> library(lattice) # need to use grid grapics
>
> ## generate two random distributions per row (probe/feature)
> ## the difference between the distributions increases from probe 1 to 4
> m <- matrix(c(rgamma(400, 1)), ncol=100)
> m[,51:100] <- m[,51:100] + 0:3
> ## rownames must be accessible by AnnotationTrack element identifier
> rownames(m) <- identifier(annTrack, "lowest")
>
> ## create a lattice density plot for the values (signals) of the two groups
> ## as the chart must be placed into a pre-set grid view port we have to use
> ## print without calling plot.new! Note, use a common prefix for all lattice.
> ## Avoid wasting space by removing y-axis decorations.
>
> ## Note, in this example 'm' will be found in the environment the 'details'
> ## function is defined in. To avoid overwriting 'm' you should use a closure
> ## or environment to access 'm'.
> details <- function(identifier, ...) {
+ 	d = data.frame(signal=m[identifier,], group=rep(c("grp1","grp2"), each=50))
+     print(densityplot(~signal, group=group, data=d, main=identifier,
+ 	scales=list(draw=FALSE, x=list(draw=TRUE)), ylab="", xlab="",
+ 	), newpage=FALSE, prefix="plot")
+ }
>
> deTrack <- AnnotationTrack(range=gr, genome="hg19", chromosome=7,
+    name="generic annotation with details per entry", stacking="squish",
+    fun=details, details.ratio=1)
>
> plotTracks(deTrack)
>
> set.seed(1234)
> deTrack <- AnnotationTrack(range=gr, genome="hg19", chromosome=7,
+    name="generic annotation with details per entry",
+    stacking="squish",fun=details,
+     details.ratio=1, selectFun=function(...){sample(c(FALSE, TRUE), 1)})
>
> plotTracks(deTrack)
>
>
>
>
>
>
> dev.off()
null device
          1
>
 .
.