Supported by Dr. Osamu Ogasawara and  . . |
|
Last data update: 2014.03.03 |
BiomartGeneRegionTrack class and methodsDescriptionA class to hold gene model data for a genomic region fetched dynamically from EBI's Biomart Ensembl data source. UsageBiomartGeneRegionTrack(start, end, biomart, chromosome, strand, genome, stacking="squish", filters=list(), featureMap=NULL, name="BiomartGeneRegionTrack", symbol=NULL, gene=NULL, entrez=NULL, transcript=NULL, ...) Arguments
DetailsA track containing all gene models in a particular region as fetched
from EBI's Biomart service. Usually the user does not have to take
care of the Biomart connection, which will be established
automatically based on the provided genome and chromosome
information. However, for full flexibility a valid
ValueThe return value of the constructor function is a new object of class
Objects from the classObjects can be created using the constructor function
Slots
ExtendsClass Class Class Class Class MethodsIn the following code chunks, Internal methods:
Inherited methods:
Internal methods:
Display ParametersThe following display parameters are set for objects of class
Additional display parameters are being inherited from the respective
parent classes. Note that not all of them may have an effect on the
plotting of
Author(s)Florian Hahne ReferencesEBI Biomart webservice at http://www.biomart.org. See Also
Examples
## Construct the object
## Not run:
bmTrack <- BiomartGeneRegionTrack(start=26682683, end=26711643,
chromosome=7, genome="mm9")

## End(Not run)


## Plotting
plotTracks(bmTrack)

## Track names
names(bmTrack)
names(bmTrack) <- "foo"
plotTracks(bmTrack)

## Subsetting and splitting
subTrack <- subset(bmTrack, from=26700000, to=26705000)
length(subTrack)
subTrack <- bmTrack[transcript(bmTrack)=="ENSMUST00000144140"]
split(bmTrack, transcript(bmTrack))

## Accessors
start(bmTrack)
end(bmTrack)
width(bmTrack)
position(bmTrack)
width(subTrack) <- width(subTrack)+100

strand(bmTrack)
strand(subTrack) <- "-"

chromosome(bmTrack)
chromosome(subTrack) <- "chrX"

genome(bmTrack)
genome(subTrack) <- "hg19"

range(bmTrack)
ranges(bmTrack)

## Annotation
identifier(bmTrack)
identifier(bmTrack, "lowest")
identifier(subTrack) <- "bar"

feature(bmTrack)
feature(subTrack) <- "foo"

exon(bmTrack)
exon(subTrack) <- letters[1:2]

gene(bmTrack)
gene(subTrack) <- "bar"

symbol(bmTrack)
symbol(subTrack) <- "foo"

transcript(bmTrack)
transcript(subTrack) <- c("foo", "bar")
chromosome(subTrack) <- "chr7"
plotTracks(subTrack)

values(bmTrack)

## Grouping
group(bmTrack)
group(subTrack) <- "Group 1"
transcript(subTrack)
plotTracks(subTrack)

## Stacking
stacking(bmTrack)
stacking(bmTrack) <- "dense"
plotTracks(bmTrack)

## coercion
as(bmTrack, "data.frame")
as(bmTrack, "UCSCData")

## HTML image map
coords(bmTrack)
tags(bmTrack)
bmTrack <- plotTracks(bmTrack)$foo
coords(bmTrack)
tags(bmTrack)
Results
R version 3.3.1 (2016-06-21) -- "Bug in Your Hair"
Copyright (C) 2016 The R Foundation for Statistical Computing
Platform: x86_64-pc-linux-gnu (64-bit)
R is free software and comes with ABSOLUTELY NO WARRANTY.
You are welcome to redistribute it under certain conditions.
Type 'license()' or 'licence()' for distribution details.
R is a collaborative project with many contributors.
Type 'contributors()' for more information and
'citation()' on how to cite R or R packages in publications.
Type 'demo()' for some demos, 'help()' for on-line help, or
'help.start()' for an HTML browser interface to help.
Type 'q()' to quit R.
> library(Gviz)
Loading required package: S4Vectors
Loading required package: stats4
Loading required package: BiocGenerics
Loading required package: parallel
Attaching package: 'BiocGenerics'
The following objects are masked from 'package:parallel':
clusterApply, clusterApplyLB, clusterCall, clusterEvalQ,
clusterExport, clusterMap, parApply, parCapply, parLapply,
parLapplyLB, parRapply, parSapply, parSapplyLB
The following objects are masked from 'package:stats':
IQR, mad, xtabs
The following objects are masked from 'package:base':
Filter, Find, Map, Position, Reduce, anyDuplicated, append,
as.data.frame, cbind, colnames, do.call, duplicated, eval, evalq,
get, grep, grepl, intersect, is.unsorted, lapply, lengths, mapply,
match, mget, order, paste, pmax, pmax.int, pmin, pmin.int, rank,
rbind, rownames, sapply, setdiff, sort, table, tapply, union,
unique, unsplit
Attaching package: 'S4Vectors'
The following objects are masked from 'package:base':
colMeans, colSums, expand.grid, rowMeans, rowSums
Loading required package: IRanges
Loading required package: GenomicRanges
Loading required package: GenomeInfoDb
Loading required package: grid
> png(filename="/home/ddbj/snapshot/RGM3/R_BC/result/Gviz/BiomartGeneRegionTrack-class.Rd_%03d_medium.png", width=480, height=480)
> ### Name: BiomartGeneRegionTrack-class
> ### Title: BiomartGeneRegionTrack class and methods
> ### Aliases: BiomartGeneRegionTrack-class BiomartGeneRegionTrack
> ### initialize,BiomartGeneRegionTrack-method
> ### subset,BiomartGeneRegionTrack-method
> ### Keywords: classes
>
> ### ** Examples
>
>
> ## Don't show:
> ## Load some sample data
> data(bmTrack)
> ## End(Don't show)
>
> ## Construct the object
> ## Not run:
> ##D bmTrack <- BiomartGeneRegionTrack(start=26682683, end=26711643,
> ##D chromosome=7, genome="mm9")
> ## End(Not run)
>
> ## Don't show:
> ## For some annoying reason the postscript device does not know about
> ## the sans font
> #if(!interactive())
> #{
> font <- ps.options()$family
> displayPars(bmTrack) <- list(fontfamily=font, fontfamily.title=font)
> #}
> ## End(Don't show)
>
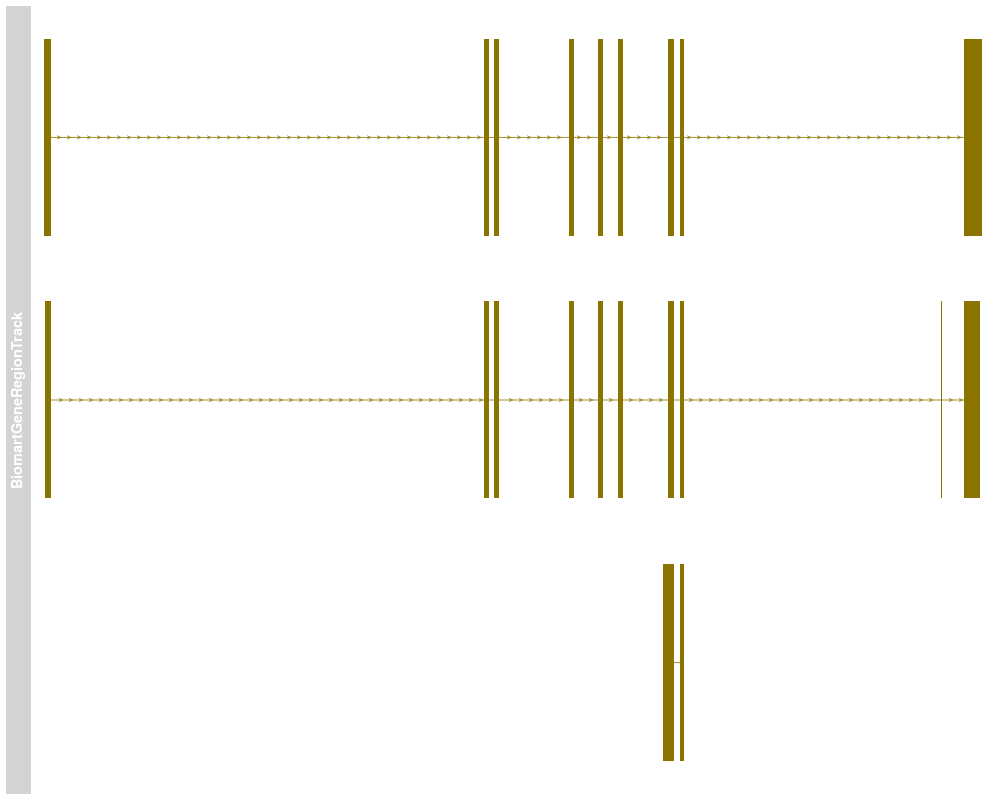
> ## Plotting
> plotTracks(bmTrack)
>
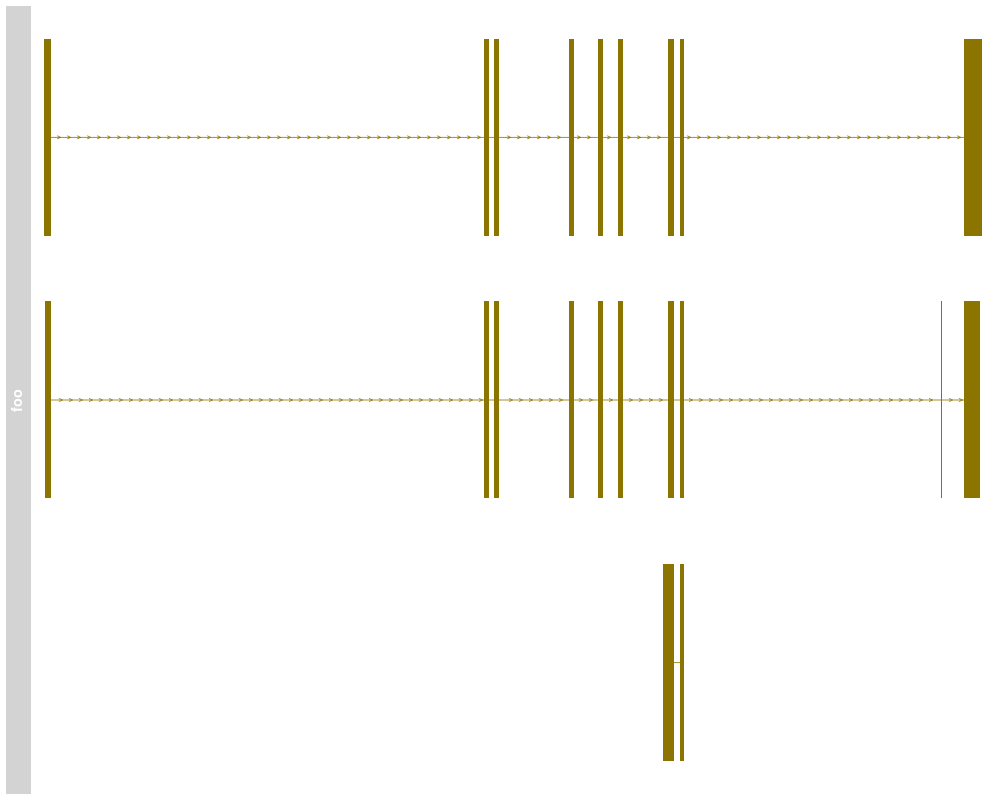
> ## Track names
> names(bmTrack)
[1] "BiomartGeneRegionTrack"
> names(bmTrack) <- "foo"
> plotTracks(bmTrack)
>
> ## Subsetting and splitting
> subTrack <- subset(bmTrack, from=26700000, to=26705000)
> length(subTrack)
[1] 21
> subTrack <- bmTrack[transcript(bmTrack)=="ENSMUST00000144140"]
> split(bmTrack, transcript(bmTrack))
$ENSMUST00000005477
GeneRegionTrack 'foo'
| genome: mm9
| active chromosome: chr7
| annotation features: 10
$ENSMUST00000072438
GeneRegionTrack 'foo'
| genome: mm9
| active chromosome: chr7
| annotation features: 9
$ENSMUST00000144140
GeneRegionTrack 'foo'
| genome: mm9
| active chromosome: chr7
| annotation features: 2
>
> ## Accessors
> start(bmTrack)
[1] 26682639 26696257 26696573 26698884 26699767 26700411 26701953 26702307
[9] 26711087 26682695 26696257 26696573 26698884 26699767 26700411 26701953
[17] 26702307 26710392 26711087 26701785 26702307
> end(bmTrack)
[1] 26682874 26696419 26696722 26699044 26699943 26700552 26702140 26702448
[9] 26711643 26682874 26696419 26696722 26699044 26699943 26700552 26702140
[17] 26702448 26710418 26711578 26702140 26702449
> width(bmTrack)
[1] 236 163 150 161 177 142 188 142 557 180 163 150 161 177 142 188 142 27 492
[20] 356 143
> position(bmTrack)
[1] 26682756 26696338 26696648 26698964 26699855 26700482 26702046 26702378
[9] 26711365 26682784 26696338 26696648 26698964 26699855 26700482 26702046
[17] 26702378 26710405 26711332 26701962 26702378
> width(subTrack) <- width(subTrack)+100
>
> strand(bmTrack)
[1] "+" "+" "+" "+" "+" "+" "+" "+" "+" "+" "+" "+" "+" "+" "+" "+" "+" "+" "+"
[20] "+" "+"
> strand(subTrack) <- "-"
>
> chromosome(bmTrack)
chr7
"chr7"
> chromosome(subTrack) <- "chrX"
>
> genome(bmTrack)
[1] "mm9"
> genome(subTrack) <- "hg19"
>
> range(bmTrack)
IRanges object with 21 ranges and 0 metadata columns:
start end width
<integer> <integer> <integer>
[1] 26682639 26682874 236
[2] 26696257 26696419 163
[3] 26696573 26696722 150
[4] 26698884 26699044 161
[5] 26699767 26699943 177
... ... ... ...
[17] 26702307 26702448 142
[18] 26710392 26710418 27
[19] 26711087 26711578 492
[20] 26701785 26702140 356
[21] 26702307 26702449 143
> ranges(bmTrack)
GRanges object with 21 ranges and 6 metadata columns:
seqnames ranges strand | feature gene
<Rle> <IRanges> <Rle> | <character> <character>
[1] chr7 [26682639, 26682874] + | protein_coding ENSMUSG00000030483
[2] chr7 [26696257, 26696419] + | protein_coding ENSMUSG00000030483
[3] chr7 [26696573, 26696722] + | protein_coding ENSMUSG00000030483
[4] chr7 [26698884, 26699044] + | protein_coding ENSMUSG00000030483
[5] chr7 [26699767, 26699943] + | protein_coding ENSMUSG00000030483
... ... ... ... . ... ...
[17] chr7 [26702307, 26702448] + | protein_coding ENSMUSG00000030483
[18] chr7 [26710392, 26710418] + | protein_coding ENSMUSG00000030483
[19] chr7 [26711087, 26711578] + | protein_coding ENSMUSG00000030483
[20] chr7 [26701785, 26702140] + | protein_coding ENSMUSG00000030483
[21] chr7 [26702307, 26702449] + | protein_coding ENSMUSG00000030483
exon transcript symbol rank
<character> <character> <character> <numeric>
[1] ENSMUSE00000742021 ENSMUST00000072438 Cyp2b10 1
[2] ENSMUSE00000449901 ENSMUST00000072438 Cyp2b10 2
[3] ENSMUSE00000199425 ENSMUST00000072438 Cyp2b10 3
[4] ENSMUSE00000511070 ENSMUST00000072438 Cyp2b10 4
[5] ENSMUSE00000514929 ENSMUST00000072438 Cyp2b10 5
... ... ... ... ...
[17] ENSMUSE00000507557 ENSMUST00000005477 Cyp2b10 8
[18] ENSMUSE00000496705 ENSMUST00000005477 Cyp2b10 9
[19] ENSMUSE00000750625 ENSMUST00000005477 Cyp2b10 10
[20] ENSMUSE00000736922 ENSMUST00000144140 Cyp2b10 1
[21] ENSMUSE00000748299 ENSMUST00000144140 Cyp2b10 2
-------
seqinfo: 1 sequence from an unspecified genome; no seqlengths
>
> ## Annotation
> identifier(bmTrack)
[1] "Cyp2b10" "Cyp2b10" "Cyp2b10" "Cyp2b10" "Cyp2b10" "Cyp2b10" "Cyp2b10"
[8] "Cyp2b10" "Cyp2b10" "Cyp2b10" "Cyp2b10" "Cyp2b10" "Cyp2b10" "Cyp2b10"
[15] "Cyp2b10" "Cyp2b10" "Cyp2b10" "Cyp2b10" "Cyp2b10" "Cyp2b10" "Cyp2b10"
> identifier(bmTrack, "lowest")
[1] "ENSMUSE00000742021" "ENSMUSE00000449901" "ENSMUSE00000199425"
[4] "ENSMUSE00000511070" "ENSMUSE00000514929" "ENSMUSE00000199423"
[7] "ENSMUSE00000535814" "ENSMUSE00000507557" "ENSMUSE00000498616"
[10] "ENSMUSE00000489385" "ENSMUSE00000449901" "ENSMUSE00000199425"
[13] "ENSMUSE00000511070" "ENSMUSE00000514929" "ENSMUSE00000199423"
[16] "ENSMUSE00000535814" "ENSMUSE00000507557" "ENSMUSE00000496705"
[19] "ENSMUSE00000750625" "ENSMUSE00000736922" "ENSMUSE00000748299"
> identifier(subTrack) <- "bar"
>
> feature(bmTrack)
[1] "protein_coding" "protein_coding" "protein_coding" "protein_coding"
[5] "protein_coding" "protein_coding" "protein_coding" "protein_coding"
[9] "protein_coding" "protein_coding" "protein_coding" "protein_coding"
[13] "protein_coding" "protein_coding" "protein_coding" "protein_coding"
[17] "protein_coding" "protein_coding" "protein_coding" "protein_coding"
[21] "protein_coding"
> feature(subTrack) <- "foo"
>
> exon(bmTrack)
[1] "ENSMUSE00000742021" "ENSMUSE00000449901" "ENSMUSE00000199425"
[4] "ENSMUSE00000511070" "ENSMUSE00000514929" "ENSMUSE00000199423"
[7] "ENSMUSE00000535814" "ENSMUSE00000507557" "ENSMUSE00000498616"
[10] "ENSMUSE00000489385" "ENSMUSE00000449901" "ENSMUSE00000199425"
[13] "ENSMUSE00000511070" "ENSMUSE00000514929" "ENSMUSE00000199423"
[16] "ENSMUSE00000535814" "ENSMUSE00000507557" "ENSMUSE00000496705"
[19] "ENSMUSE00000750625" "ENSMUSE00000736922" "ENSMUSE00000748299"
> exon(subTrack) <- letters[1:2]
>
> gene(bmTrack)
[1] "ENSMUSG00000030483" "ENSMUSG00000030483" "ENSMUSG00000030483"
[4] "ENSMUSG00000030483" "ENSMUSG00000030483" "ENSMUSG00000030483"
[7] "ENSMUSG00000030483" "ENSMUSG00000030483" "ENSMUSG00000030483"
[10] "ENSMUSG00000030483" "ENSMUSG00000030483" "ENSMUSG00000030483"
[13] "ENSMUSG00000030483" "ENSMUSG00000030483" "ENSMUSG00000030483"
[16] "ENSMUSG00000030483" "ENSMUSG00000030483" "ENSMUSG00000030483"
[19] "ENSMUSG00000030483" "ENSMUSG00000030483" "ENSMUSG00000030483"
> gene(subTrack) <- "bar"
>
> symbol(bmTrack)
[1] "Cyp2b10" "Cyp2b10" "Cyp2b10" "Cyp2b10" "Cyp2b10" "Cyp2b10" "Cyp2b10"
[8] "Cyp2b10" "Cyp2b10" "Cyp2b10" "Cyp2b10" "Cyp2b10" "Cyp2b10" "Cyp2b10"
[15] "Cyp2b10" "Cyp2b10" "Cyp2b10" "Cyp2b10" "Cyp2b10" "Cyp2b10" "Cyp2b10"
> symbol(subTrack) <- "foo"
>
> transcript(bmTrack)
[1] "ENSMUST00000072438" "ENSMUST00000072438" "ENSMUST00000072438"
[4] "ENSMUST00000072438" "ENSMUST00000072438" "ENSMUST00000072438"
[7] "ENSMUST00000072438" "ENSMUST00000072438" "ENSMUST00000072438"
[10] "ENSMUST00000005477" "ENSMUST00000005477" "ENSMUST00000005477"
[13] "ENSMUST00000005477" "ENSMUST00000005477" "ENSMUST00000005477"
[16] "ENSMUST00000005477" "ENSMUST00000005477" "ENSMUST00000005477"
[19] "ENSMUST00000005477" "ENSMUST00000144140" "ENSMUST00000144140"
> transcript(subTrack) <- c("foo", "bar")
> chromosome(subTrack) <- "chr7"
> plotTracks(subTrack)
>
> values(bmTrack)
feature gene exon transcript
1 protein_coding ENSMUSG00000030483 ENSMUSE00000742021 ENSMUST00000072438
2 protein_coding ENSMUSG00000030483 ENSMUSE00000449901 ENSMUST00000072438
3 protein_coding ENSMUSG00000030483 ENSMUSE00000199425 ENSMUST00000072438
4 protein_coding ENSMUSG00000030483 ENSMUSE00000511070 ENSMUST00000072438
5 protein_coding ENSMUSG00000030483 ENSMUSE00000514929 ENSMUST00000072438
6 protein_coding ENSMUSG00000030483 ENSMUSE00000199423 ENSMUST00000072438
7 protein_coding ENSMUSG00000030483 ENSMUSE00000535814 ENSMUST00000072438
8 protein_coding ENSMUSG00000030483 ENSMUSE00000507557 ENSMUST00000072438
9 protein_coding ENSMUSG00000030483 ENSMUSE00000498616 ENSMUST00000072438
10 protein_coding ENSMUSG00000030483 ENSMUSE00000489385 ENSMUST00000005477
11 protein_coding ENSMUSG00000030483 ENSMUSE00000449901 ENSMUST00000005477
12 protein_coding ENSMUSG00000030483 ENSMUSE00000199425 ENSMUST00000005477
13 protein_coding ENSMUSG00000030483 ENSMUSE00000511070 ENSMUST00000005477
14 protein_coding ENSMUSG00000030483 ENSMUSE00000514929 ENSMUST00000005477
15 protein_coding ENSMUSG00000030483 ENSMUSE00000199423 ENSMUST00000005477
16 protein_coding ENSMUSG00000030483 ENSMUSE00000535814 ENSMUST00000005477
17 protein_coding ENSMUSG00000030483 ENSMUSE00000507557 ENSMUST00000005477
18 protein_coding ENSMUSG00000030483 ENSMUSE00000496705 ENSMUST00000005477
19 protein_coding ENSMUSG00000030483 ENSMUSE00000750625 ENSMUST00000005477
20 protein_coding ENSMUSG00000030483 ENSMUSE00000736922 ENSMUST00000144140
21 protein_coding ENSMUSG00000030483 ENSMUSE00000748299 ENSMUST00000144140
symbol rank
1 Cyp2b10 1
2 Cyp2b10 2
3 Cyp2b10 3
4 Cyp2b10 4
5 Cyp2b10 5
6 Cyp2b10 6
7 Cyp2b10 7
8 Cyp2b10 8
9 Cyp2b10 9
10 Cyp2b10 1
11 Cyp2b10 2
12 Cyp2b10 3
13 Cyp2b10 4
14 Cyp2b10 5
15 Cyp2b10 6
16 Cyp2b10 7
17 Cyp2b10 8
18 Cyp2b10 9
19 Cyp2b10 10
20 Cyp2b10 1
21 Cyp2b10 2
>
> ## Grouping
> group(bmTrack)
[1] "ENSMUST00000072438" "ENSMUST00000072438" "ENSMUST00000072438"
[4] "ENSMUST00000072438" "ENSMUST00000072438" "ENSMUST00000072438"
[7] "ENSMUST00000072438" "ENSMUST00000072438" "ENSMUST00000072438"
[10] "ENSMUST00000005477" "ENSMUST00000005477" "ENSMUST00000005477"
[13] "ENSMUST00000005477" "ENSMUST00000005477" "ENSMUST00000005477"
[16] "ENSMUST00000005477" "ENSMUST00000005477" "ENSMUST00000005477"
[19] "ENSMUST00000005477" "ENSMUST00000144140" "ENSMUST00000144140"
> group(subTrack) <- "Group 1"
> transcript(subTrack)
[1] "Group 1" "Group 1"
> plotTracks(subTrack)
>
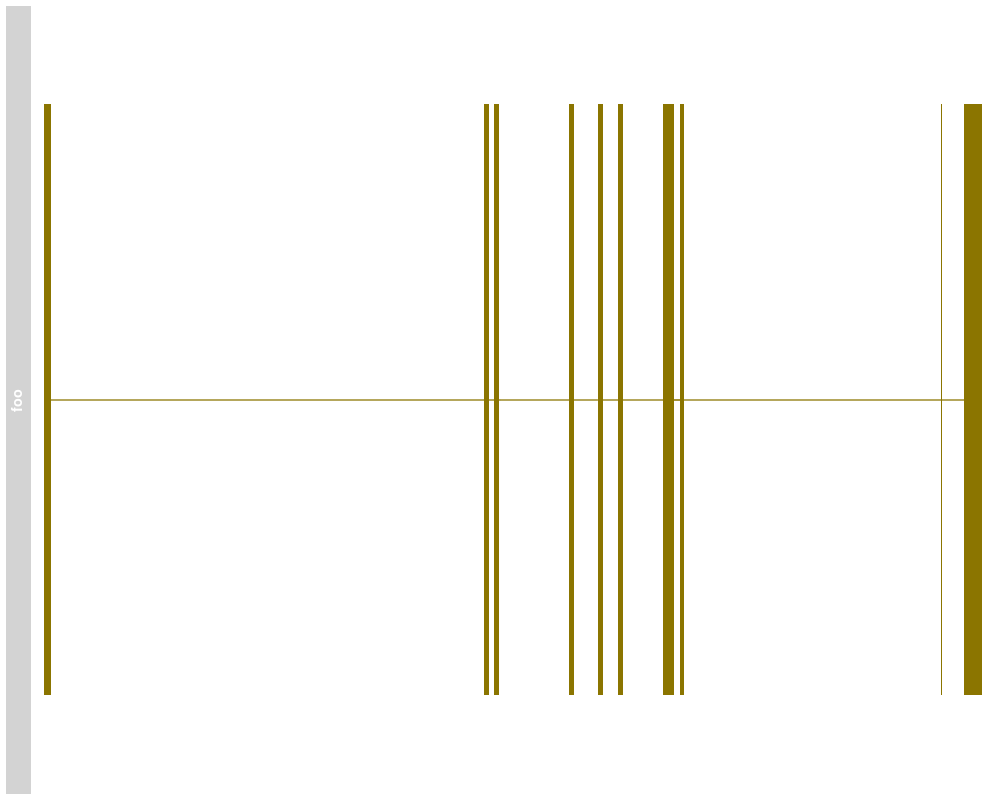
> ## Stacking
> stacking(bmTrack)
[1] "squish"
> stacking(bmTrack) <- "dense"
> plotTracks(bmTrack)
>
> ## coercion
> as(bmTrack, "data.frame")
X.seqnames X.start X.end X.width X.strand X.feature
1 chr7 26682639 26682874 236 + protein_coding
2 chr7 26696257 26696419 163 + protein_coding
3 chr7 26696573 26696722 150 + protein_coding
4 chr7 26698884 26699044 161 + protein_coding
5 chr7 26699767 26699943 177 + protein_coding
6 chr7 26700411 26700552 142 + protein_coding
7 chr7 26701953 26702140 188 + protein_coding
8 chr7 26702307 26702448 142 + protein_coding
9 chr7 26711087 26711643 557 + protein_coding
10 chr7 26682695 26682874 180 + protein_coding
11 chr7 26696257 26696419 163 + protein_coding
12 chr7 26696573 26696722 150 + protein_coding
13 chr7 26698884 26699044 161 + protein_coding
14 chr7 26699767 26699943 177 + protein_coding
15 chr7 26700411 26700552 142 + protein_coding
16 chr7 26701953 26702140 188 + protein_coding
17 chr7 26702307 26702448 142 + protein_coding
18 chr7 26710392 26710418 27 + protein_coding
19 chr7 26711087 26711578 492 + protein_coding
20 chr7 26701785 26702140 356 + protein_coding
21 chr7 26702307 26702449 143 + protein_coding
X.gene X.exon X.transcript X.symbol X.rank
1 ENSMUSG00000030483 ENSMUSE00000742021 ENSMUST00000072438 Cyp2b10 1
2 ENSMUSG00000030483 ENSMUSE00000449901 ENSMUST00000072438 Cyp2b10 2
3 ENSMUSG00000030483 ENSMUSE00000199425 ENSMUST00000072438 Cyp2b10 3
4 ENSMUSG00000030483 ENSMUSE00000511070 ENSMUST00000072438 Cyp2b10 4
5 ENSMUSG00000030483 ENSMUSE00000514929 ENSMUST00000072438 Cyp2b10 5
6 ENSMUSG00000030483 ENSMUSE00000199423 ENSMUST00000072438 Cyp2b10 6
7 ENSMUSG00000030483 ENSMUSE00000535814 ENSMUST00000072438 Cyp2b10 7
8 ENSMUSG00000030483 ENSMUSE00000507557 ENSMUST00000072438 Cyp2b10 8
9 ENSMUSG00000030483 ENSMUSE00000498616 ENSMUST00000072438 Cyp2b10 9
10 ENSMUSG00000030483 ENSMUSE00000489385 ENSMUST00000005477 Cyp2b10 1
11 ENSMUSG00000030483 ENSMUSE00000449901 ENSMUST00000005477 Cyp2b10 2
12 ENSMUSG00000030483 ENSMUSE00000199425 ENSMUST00000005477 Cyp2b10 3
13 ENSMUSG00000030483 ENSMUSE00000511070 ENSMUST00000005477 Cyp2b10 4
14 ENSMUSG00000030483 ENSMUSE00000514929 ENSMUST00000005477 Cyp2b10 5
15 ENSMUSG00000030483 ENSMUSE00000199423 ENSMUST00000005477 Cyp2b10 6
16 ENSMUSG00000030483 ENSMUSE00000535814 ENSMUST00000005477 Cyp2b10 7
17 ENSMUSG00000030483 ENSMUSE00000507557 ENSMUST00000005477 Cyp2b10 8
18 ENSMUSG00000030483 ENSMUSE00000496705 ENSMUST00000005477 Cyp2b10 9
19 ENSMUSG00000030483 ENSMUSE00000750625 ENSMUST00000005477 Cyp2b10 10
20 ENSMUSG00000030483 ENSMUSE00000736922 ENSMUST00000144140 Cyp2b10 1
21 ENSMUSG00000030483 ENSMUSE00000748299 ENSMUST00000144140 Cyp2b10 2
feature gene exon transcript
1 protein_coding ENSMUSG00000030483 ENSMUSE00000742021 ENSMUST00000072438
2 protein_coding ENSMUSG00000030483 ENSMUSE00000449901 ENSMUST00000072438
3 protein_coding ENSMUSG00000030483 ENSMUSE00000199425 ENSMUST00000072438
4 protein_coding ENSMUSG00000030483 ENSMUSE00000511070 ENSMUST00000072438
5 protein_coding ENSMUSG00000030483 ENSMUSE00000514929 ENSMUST00000072438
6 protein_coding ENSMUSG00000030483 ENSMUSE00000199423 ENSMUST00000072438
7 protein_coding ENSMUSG00000030483 ENSMUSE00000535814 ENSMUST00000072438
8 protein_coding ENSMUSG00000030483 ENSMUSE00000507557 ENSMUST00000072438
9 protein_coding ENSMUSG00000030483 ENSMUSE00000498616 ENSMUST00000072438
10 protein_coding ENSMUSG00000030483 ENSMUSE00000489385 ENSMUST00000005477
11 protein_coding ENSMUSG00000030483 ENSMUSE00000449901 ENSMUST00000005477
12 protein_coding ENSMUSG00000030483 ENSMUSE00000199425 ENSMUST00000005477
13 protein_coding ENSMUSG00000030483 ENSMUSE00000511070 ENSMUST00000005477
14 protein_coding ENSMUSG00000030483 ENSMUSE00000514929 ENSMUST00000005477
15 protein_coding ENSMUSG00000030483 ENSMUSE00000199423 ENSMUST00000005477
16 protein_coding ENSMUSG00000030483 ENSMUSE00000535814 ENSMUST00000005477
17 protein_coding ENSMUSG00000030483 ENSMUSE00000507557 ENSMUST00000005477
18 protein_coding ENSMUSG00000030483 ENSMUSE00000496705 ENSMUST00000005477
19 protein_coding ENSMUSG00000030483 ENSMUSE00000750625 ENSMUST00000005477
20 protein_coding ENSMUSG00000030483 ENSMUSE00000736922 ENSMUST00000144140
21 protein_coding ENSMUSG00000030483 ENSMUSE00000748299 ENSMUST00000144140
symbol rank
1 Cyp2b10 1
2 Cyp2b10 2
3 Cyp2b10 3
4 Cyp2b10 4
5 Cyp2b10 5
6 Cyp2b10 6
7 Cyp2b10 7
8 Cyp2b10 8
9 Cyp2b10 9
10 Cyp2b10 1
11 Cyp2b10 2
12 Cyp2b10 3
13 Cyp2b10 4
14 Cyp2b10 5
15 Cyp2b10 6
16 Cyp2b10 7
17 Cyp2b10 8
18 Cyp2b10 9
19 Cyp2b10 10
20 Cyp2b10 1
21 Cyp2b10 2
> as(bmTrack, "UCSCData")
UCSC track 'foo'
UCSCData object with 3 ranges and 6 metadata columns:
seqnames ranges strand | id
<Rle> <IRanges> <Rle> | <character>
ENSMUST00000005477 chr7 [26682695, 26711578] + | ENSMUST00000005477
ENSMUST00000072438 chr7 [26682639, 26711643] + | ENSMUST00000072438
ENSMUST00000144140 chr7 [26701785, 26702449] + | ENSMUST00000144140
name itemRgb blockCount
<character> <character> <integer>
ENSMUST00000005477 Cyp2b10 gold4 10
ENSMUST00000072438 Cyp2b10 gold4 9
ENSMUST00000144140 Cyp2b10 gold4 2
blockSizes
<character>
ENSMUST00000005477 180,163,150,161,177,142,188,142,27,492
ENSMUST00000072438 236,163,150,161,177,142,188,142,557
ENSMUST00000144140 356,143
blockStarts
<character>
ENSMUST00000005477 0,13562,13878,16189,17072,17716,19258,19612,27697,28392
ENSMUST00000072438 0,13618,13934,16245,17128,17772,19314,19668,28448
ENSMUST00000144140 0,522
-------
seqinfo: 1 sequence from an unspecified genome; no seqlengths
>
> ## HTML image map
> coords(bmTrack)
NULL
> tags(bmTrack)
NULL
> bmTrack <- plotTracks(bmTrack)$foo
> coords(bmTrack)
x1 y1 x2 y2
ENSMUSE00000742021 38.32764 64.5 41.79997 415.5
ENSMUSE00000449901 239.54551 64.5 241.93921 415.5
ENSMUSE00000199425 244.21469 64.5 246.41630 415.5
ENSMUSE00000511070 278.36174 64.5 280.72588 415.5
ENSMUSE00000514929 291.40884 64.5 294.00939 415.5
ENSMUSE00000199423 300.92450 64.5 303.00790 415.5
ENSMUSE00000535814 323.70890 64.5 326.47199 415.5
ENSMUSE00000507557 328.93956 64.5 331.02296 415.5
ENSMUSE00000498616 458.67175 64.5 466.88714 415.5
ENSMUSE00000489385 39.15509 64.5 41.79997 415.5
ENSMUSE00000449901.1 239.54551 64.5 241.93921 415.5
ENSMUSE00000199425.1 244.21469 64.5 246.41630 415.5
ENSMUSE00000511070.1 278.36174 64.5 280.72588 415.5
ENSMUSE00000514929.1 291.40884 64.5 294.00939 415.5
ENSMUSE00000199423.1 300.92450 64.5 303.00790 415.5
ENSMUSE00000535814.1 323.70890 64.5 326.47199 415.5
ENSMUSE00000507557.1 328.93956 64.5 331.02296 415.5
ENSMUSE00000496705 448.09222 64.5 449.08221 415.5
ENSMUSE00000750625 458.67175 64.5 465.92671 415.5
ENSMUSE00000736922 321.22656 64.5 326.47199 415.5
ENSMUSE00000748299 328.93956 64.5 331.03774 415.5
> tags(bmTrack)
$fill
ENSMUSE00000742021 ENSMUSE00000449901 ENSMUSE00000199425
"gold4" "gold4" "gold4"
ENSMUSE00000511070 ENSMUSE00000514929 ENSMUSE00000199423
"gold4" "gold4" "gold4"
ENSMUSE00000535814 ENSMUSE00000507557 ENSMUSE00000498616
"gold4" "gold4" "gold4"
ENSMUSE00000489385 ENSMUSE00000449901.1 ENSMUSE00000199425.1
"gold4" "gold4" "gold4"
ENSMUSE00000511070.1 ENSMUSE00000514929.1 ENSMUSE00000199423.1
"gold4" "gold4" "gold4"
ENSMUSE00000535814.1 ENSMUSE00000507557.1 ENSMUSE00000496705
"gold4" "gold4" "gold4"
ENSMUSE00000750625 ENSMUSE00000736922 ENSMUSE00000748299
"gold4" "gold4" "gold4"
$strand
ENSMUSE00000742021 ENSMUSE00000449901 ENSMUSE00000199425
"+" "+" "+"
ENSMUSE00000511070 ENSMUSE00000514929 ENSMUSE00000199423
"+" "+" "+"
ENSMUSE00000535814 ENSMUSE00000507557 ENSMUSE00000498616
"+" "+" "+"
ENSMUSE00000489385 ENSMUSE00000449901.1 ENSMUSE00000199425.1
"+" "+" "+"
ENSMUSE00000511070.1 ENSMUSE00000514929.1 ENSMUSE00000199423.1
"+" "+" "+"
ENSMUSE00000535814.1 ENSMUSE00000507557.1 ENSMUSE00000496705
"+" "+" "+"
ENSMUSE00000750625 ENSMUSE00000736922 ENSMUSE00000748299
"+" "+" "+"
$text
ENSMUSE00000742021 ENSMUSE00000449901 ENSMUSE00000199425
"ENSMUSE00000742021" "ENSMUSE00000449901" "ENSMUSE00000199425"
ENSMUSE00000511070 ENSMUSE00000514929 ENSMUSE00000199423
"ENSMUSE00000511070" "ENSMUSE00000514929" "ENSMUSE00000199423"
ENSMUSE00000535814 ENSMUSE00000507557 ENSMUSE00000498616
"ENSMUSE00000535814" "ENSMUSE00000507557" "ENSMUSE00000498616"
ENSMUSE00000489385 ENSMUSE00000449901.1 ENSMUSE00000199425.1
"ENSMUSE00000489385" "ENSMUSE00000449901" "ENSMUSE00000199425"
ENSMUSE00000511070.1 ENSMUSE00000514929.1 ENSMUSE00000199423.1
"ENSMUSE00000511070" "ENSMUSE00000514929" "ENSMUSE00000199423"
ENSMUSE00000535814.1 ENSMUSE00000507557.1 ENSMUSE00000496705
"ENSMUSE00000535814" "ENSMUSE00000507557" "ENSMUSE00000496705"
ENSMUSE00000750625 ENSMUSE00000736922 ENSMUSE00000748299
"ENSMUSE00000750625" "ENSMUSE00000736922" "ENSMUSE00000748299"
$start
ENSMUSE00000742021 ENSMUSE00000449901 ENSMUSE00000199425
"26682639" "26696257" "26696573"
ENSMUSE00000511070 ENSMUSE00000514929 ENSMUSE00000199423
"26698884" "26699767" "26700411"
ENSMUSE00000535814 ENSMUSE00000507557 ENSMUSE00000498616
"26701953" "26702307" "26711087"
ENSMUSE00000489385 ENSMUSE00000449901.1 ENSMUSE00000199425.1
"26682695" "26696257" "26696573"
ENSMUSE00000511070.1 ENSMUSE00000514929.1 ENSMUSE00000199423.1
"26698884" "26699767" "26700411"
ENSMUSE00000535814.1 ENSMUSE00000507557.1 ENSMUSE00000496705
"26701953" "26702307" "26710371"
ENSMUSE00000750625 ENSMUSE00000736922 ENSMUSE00000748299
"26711087" "26701785" "26702307"
$end
ENSMUSE00000742021 ENSMUSE00000449901 ENSMUSE00000199425
"26682874" "26696419" "26696722"
ENSMUSE00000511070 ENSMUSE00000514929 ENSMUSE00000199423
"26699044" "26699943" "26700552"
ENSMUSE00000535814 ENSMUSE00000507557 ENSMUSE00000498616
"26702140" "26702448" "26711643"
ENSMUSE00000489385 ENSMUSE00000449901.1 ENSMUSE00000199425.1
"26682874" "26696419" "26696722"
ENSMUSE00000511070.1 ENSMUSE00000514929.1 ENSMUSE00000199423.1
"26699044" "26699943" "26700552"
ENSMUSE00000535814.1 ENSMUSE00000507557.1 ENSMUSE00000496705
"26702140" "26702448" "26710438"
ENSMUSE00000750625 ENSMUSE00000736922 ENSMUSE00000748299
"26711578" "26702140" "26702449"
$feature
ENSMUSE00000742021 ENSMUSE00000449901 ENSMUSE00000199425
"protein_coding" "protein_coding" "protein_coding"
ENSMUSE00000511070 ENSMUSE00000514929 ENSMUSE00000199423
"protein_coding" "protein_coding" "protein_coding"
ENSMUSE00000535814 ENSMUSE00000507557 ENSMUSE00000498616
"protein_coding" "protein_coding" "protein_coding"
ENSMUSE00000489385 ENSMUSE00000449901.1 ENSMUSE00000199425.1
"protein_coding" "protein_coding" "protein_coding"
ENSMUSE00000511070.1 ENSMUSE00000514929.1 ENSMUSE00000199423.1
"protein_coding" "protein_coding" "protein_coding"
ENSMUSE00000535814.1 ENSMUSE00000507557.1 ENSMUSE00000496705
"protein_coding" "protein_coding" "protein_coding"
ENSMUSE00000750625 ENSMUSE00000736922 ENSMUSE00000748299
"protein_coding" "protein_coding" "protein_coding"
$gene
ENSMUSE00000742021 ENSMUSE00000449901 ENSMUSE00000199425
"ENSMUSG00000030483" "ENSMUSG00000030483" "ENSMUSG00000030483"
ENSMUSE00000511070 ENSMUSE00000514929 ENSMUSE00000199423
"ENSMUSG00000030483" "ENSMUSG00000030483" "ENSMUSG00000030483"
ENSMUSE00000535814 ENSMUSE00000507557 ENSMUSE00000498616
"ENSMUSG00000030483" "ENSMUSG00000030483" "ENSMUSG00000030483"
ENSMUSE00000489385 ENSMUSE00000449901.1 ENSMUSE00000199425.1
"ENSMUSG00000030483" "ENSMUSG00000030483" "ENSMUSG00000030483"
ENSMUSE00000511070.1 ENSMUSE00000514929.1 ENSMUSE00000199423.1
"ENSMUSG00000030483" "ENSMUSG00000030483" "ENSMUSG00000030483"
ENSMUSE00000535814.1 ENSMUSE00000507557.1 ENSMUSE00000496705
"ENSMUSG00000030483" "ENSMUSG00000030483" "ENSMUSG00000030483"
ENSMUSE00000750625 ENSMUSE00000736922 ENSMUSE00000748299
"ENSMUSG00000030483" "ENSMUSG00000030483" "ENSMUSG00000030483"
$exon
ENSMUSE00000742021 ENSMUSE00000449901 ENSMUSE00000199425
"ENSMUSE00000742021" "ENSMUSE00000449901" "ENSMUSE00000199425"
ENSMUSE00000511070 ENSMUSE00000514929 ENSMUSE00000199423
"ENSMUSE00000511070" "ENSMUSE00000514929" "ENSMUSE00000199423"
ENSMUSE00000535814 ENSMUSE00000507557 ENSMUSE00000498616
"ENSMUSE00000535814" "ENSMUSE00000507557" "ENSMUSE00000498616"
ENSMUSE00000489385 ENSMUSE00000449901.1 ENSMUSE00000199425.1
"ENSMUSE00000489385" "ENSMUSE00000449901" "ENSMUSE00000199425"
ENSMUSE00000511070.1 ENSMUSE00000514929.1 ENSMUSE00000199423.1
"ENSMUSE00000511070" "ENSMUSE00000514929" "ENSMUSE00000199423"
ENSMUSE00000535814.1 ENSMUSE00000507557.1 ENSMUSE00000496705
"ENSMUSE00000535814" "ENSMUSE00000507557" "ENSMUSE00000496705"
ENSMUSE00000750625 ENSMUSE00000736922 ENSMUSE00000748299
"ENSMUSE00000750625" "ENSMUSE00000736922" "ENSMUSE00000748299"
$transcript
ENSMUSE00000742021 ENSMUSE00000449901 ENSMUSE00000199425
"ENSMUST00000072438" "ENSMUST00000072438" "ENSMUST00000072438"
ENSMUSE00000511070 ENSMUSE00000514929 ENSMUSE00000199423
"ENSMUST00000072438" "ENSMUST00000072438" "ENSMUST00000072438"
ENSMUSE00000535814 ENSMUSE00000507557 ENSMUSE00000498616
"ENSMUST00000072438" "ENSMUST00000072438" "ENSMUST00000072438"
ENSMUSE00000489385 ENSMUSE00000449901.1 ENSMUSE00000199425.1
"ENSMUST00000005477" "ENSMUST00000005477" "ENSMUST00000005477"
ENSMUSE00000511070.1 ENSMUSE00000514929.1 ENSMUSE00000199423.1
"ENSMUST00000005477" "ENSMUST00000005477" "ENSMUST00000005477"
ENSMUSE00000535814.1 ENSMUSE00000507557.1 ENSMUSE00000496705
"ENSMUST00000005477" "ENSMUST00000005477" "ENSMUST00000005477"
ENSMUSE00000750625 ENSMUSE00000736922 ENSMUSE00000748299
"ENSMUST00000005477" "ENSMUST00000144140" "ENSMUST00000144140"
$symbol
ENSMUSE00000742021 ENSMUSE00000449901 ENSMUSE00000199425
"Cyp2b10" "Cyp2b10" "Cyp2b10"
ENSMUSE00000511070 ENSMUSE00000514929 ENSMUSE00000199423
"Cyp2b10" "Cyp2b10" "Cyp2b10"
ENSMUSE00000535814 ENSMUSE00000507557 ENSMUSE00000498616
"Cyp2b10" "Cyp2b10" "Cyp2b10"
ENSMUSE00000489385 ENSMUSE00000449901.1 ENSMUSE00000199425.1
"Cyp2b10" "Cyp2b10" "Cyp2b10"
ENSMUSE00000511070.1 ENSMUSE00000514929.1 ENSMUSE00000199423.1
"Cyp2b10" "Cyp2b10" "Cyp2b10"
ENSMUSE00000535814.1 ENSMUSE00000507557.1 ENSMUSE00000496705
"Cyp2b10" "Cyp2b10" "Cyp2b10"
ENSMUSE00000750625 ENSMUSE0
|